Market activity is expected to be thin as US market will be closed on December 24 (Friday), along with a lightened economic calendar as the Christmas holiday breaks begins.
Investors may be hopeful of a Santa Claus rally into the year-end, which calls for positive market performance over this two weeks. However, the surging Omicron COVID-19 cases triggered tighter curbs in Europe and threatened to swamp the global economy into the New Year.
The COVID-19 situation have also further weighed on global markets with sporting events continuing to get postponed, President Biden warning of “winter of severe illness and death” for those unvaccinated against COVID-19, and former FDA Commissioner Gottlieb suggesting that businesses in New York might voluntarily close for a few weeks due to surging cases. The strain has also been found through testing in 43 out of 50 U.S. states and around 90 countries,
Here is what you need to know to start your week.
Key Economic Calendar (Weekly)
Key economic data to follow include Q3 US GDP updates and PCE Index, the Fed’s preferred inflation gauge.
Wednesday
8:30: US – GDP predicted to remain unchanged at 2.1% QoQ.
Thursday
8:30: US – Core PCE Price Index: predicted to remain unchanged at 0.4% MoM.
Top 3 Leading and Lagging Sectors (Weekly)
1. $XLV (Healthcare) +3.76%
2. $XLRE (Real Estate) +2.39%
3. $XLP (Consumer Staples) +0.98%
$SPX -1.94%
1. $XLE (Energy) -5.01%
2. $XLY (Consumer Discretionary) -4.73%
3. $XLK (Technology) -4.00%
Market Breath (Weekly)
% of Stocks Above 200 DMA = 38.01% (-9.63%)
% of Stocks Above 50 DMA = 26.67% (-21.23%)
Market Technicals

$SPX (S&P 500) vs $RSP (S&P 500 Equal Weight) – (Net High/Low -43)
The immediate support to watch for $SPX this week is at 4,600 level, a further break of the low of Friday’s high volume price candle, confluence with 50D MA. The immediate anchored VWAP resistance is at 4,635, a level to be taken out for signs of strength in this market.

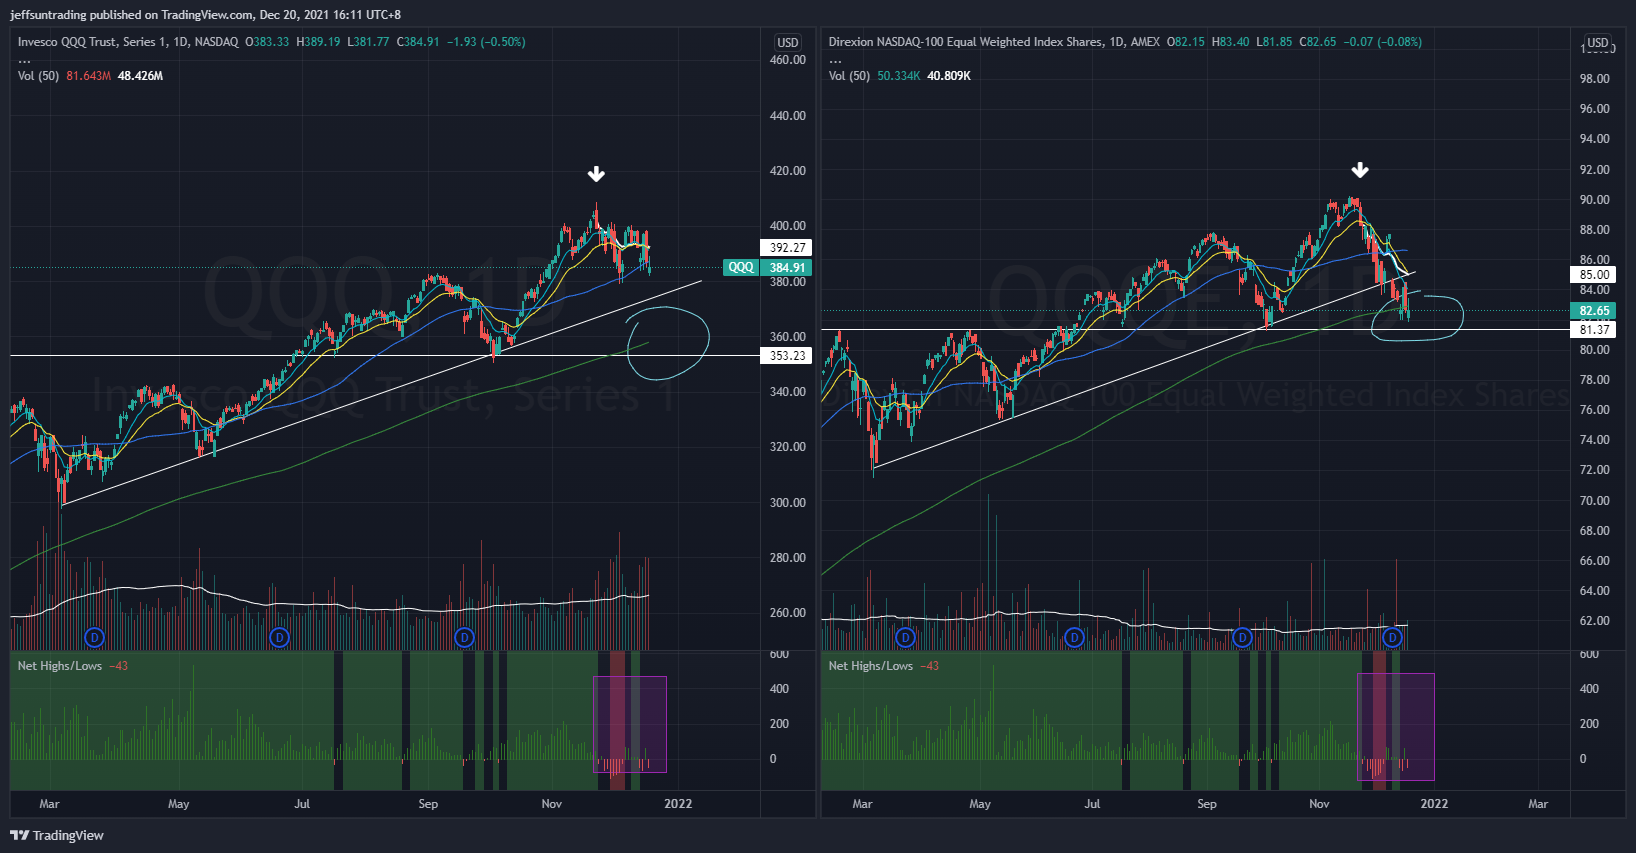
$QQQ (Nasdaq 100) vs $QQQE (Nasdaq 100 Equal Weight)
$QQQ vs $QQQE actually reflected a greater disparity than $SPX vs $RSP during this correction. It is the first time in 21 months where $QQQE treaded against its 200DMA after a multi month long rally. $QQQ is currently 7% away from its 200DMA, also signifying a 7% price divergence from its equal weighted index. The key level to watch is on $QQQE resistance turned major support level at $81. A breakdown of this level will infuse further selling into this correction.

$PCCE (Put/Call Ratio Equity) & $VIX (Volatility S&P 500)
The spike level to watch for $PCCE is at 1.00, where the current reading of 0.78 reflects neutrality of the market. $VIX on the other end have exceeded a threshold reading of 24.50 for the second time this month. The last spike at this level happened in late September 2021 where market further corrected -3.8%.

$IEI/HYG (Credit Spread)
Credit Spread have creeped up to 1.50% since we last monitored a month ago (1.48%). 1.54% is a level to be watched.


