
The current month has presented a challenging environment for executing breakout trades. The prevalence of frequent intraday whipsaw movements has made it difficult to effectively carry trades forward.
Throughout history, these five sectors (a combination of 64% in $SPY weighting) have consistently demonstrated a higher frequency of breakout opportunities. Therefore, it is crucial to ascertain our current position by reviewing these sectors. I will arrange them in the order of their current RS ratings (strength level) and post them accordingly.
Additionally, I will also include my routine of simple excel tabulation with monthly ISM Manufacturing PMI’s report and a key industry group that is closely monitored by economists, investors, policymakers and a renowned hedge fund manager. Both of these resource serve as leading indicators that offer valuable insights into the overall direction and well-being of the broader economy.
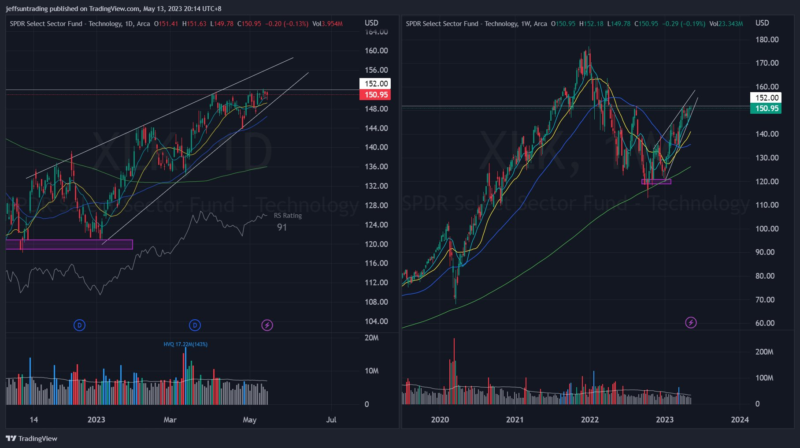
1. $XLK – Technology (26% Weighting in $SPY)
At present, the SPDR sector exhibiting the highest strength among the eleven sectors is +34% from its 52-week low. This week, $XLK is testing its 52-week high at $151 from August 2022. $152 to clear. Despite its upward price movement since 2023, it has also formed a bearish rising wedge pattern.
Note $AAPL & $MSFT exceeds 48% weighting in the sector.

2. $XLV – Healthcare (14% Weighting in $SPY)
Within a month, $XLV experienced a noteworthy 10% rally from its low in March, which holds significance considering the sector’s low ADR% (0.9%). Presently, a bullish flag pattern is forming, although the price action within the flag is still somewhat loose.
Interestingly, when you conduct scans for the strongest performance over a 1-week, 1-month, and 3-month period, the results are largely dominated small and midcap names from the pharmaceutical group.

3. $XLI – Industrial (8% Weighting in $SPY)
Since the start of 2023, $XLI has been characterized by loose price movements. In recent weeks, we have observed a tightening pattern forming within a symmetrical triangle. In order for a bullish bias scenario to be confirmed, it would be necessary for $XLI to first reclaim the $101 level.
Though $XLI only stand 8% weighting in $SPY, the sector is considered a leading one as it pose significant influence to the broader economy due to several reasons;
- Business Investment, industrial companies make substantial investments in CAPEX such as machinery, equipment and infrastructure and such increase in spending indicates confidence.
- Employment, major source of employment and significant portion of the workforce.
- Global Trade and Manufacturing, the sector is closely tied to global trade in both export/import levels, and manufacturing output.
- Government Spending, industrial companies are often the first beneficiary from government infrastructure projects investment ie. transportation network, utilities, and public works.

The ISM Manufacturing PMI, released on first business day of each month, also presents great dataset as a leading indicator of the economic health. It’s surveyed from the Purchasing Managers of industrial businesses, who have the most up-to-date information about the company’s perception of the economy. This makes them a key determinant of economic well-being, acting as a leading indicator.
The excel table are my April’s tabulation. I strongly recommend to explore this regular routine as a reference to sector and industry group charts. You can extract the monthly data from the link below.
https://www.ismworld.org/supply-management-news-and-reports/reports/ism-report-on-business/


4. $XLY – Consumer Discretionary (10% Weighting in $SPY)
$XLY has shown a significant increase of +17% from its 52-week low from recent December. It has been trading within a narrow 4% range over the past three weeks, and appears to be positioning itself for a potential breakout from the ascending triangle pattern it has formed.
Notably, the 200-week moving average previously rejected this progress in early February. However, it now appears that $XLY is preparing to make another attempt at breaching this resistance.

5. $XLE – Energy (4.6% Weighting in $SPY)
Similar to $XLI, $XLE has a relatively low weighting but exerts a significant impact on the broader economy. This is because $XLE is recognized as a leading indicator, offering valuable insights into energy consumption, commodity prices, capital expenditure, geopolitical developments, and employment trends.
Among the five sectors mentioned, $XLE currently has the lowest RS Rating, and it becomes apparent why this is the case. Since November 2022, it has been forming a series of lower highs, exhibiting limited participation in the broader rally that occurred in January. Currently, it is trading below all major moving averages, indicating a weakened position. Furthermore, relative weakness has experienced another sharp dive in recent weeks.
The only immediate support level to watch for is the $76 level, which was the recent March low.

BONUS: $XHB – Homebuilders (Leading Industry Group)
Stanley Druckenmiller has frequently shared his approach of using $XHB as a leading indicator to gain insights into the direction and overall health of the broader economy in his interviews. This is primarily because of its strong correlation with the overall economic well-being. Several reasons why it is seen as such, i. Economic Sensitivity, ii. Forward-Looking Industry, iii. Ripple effect on related sectors, iv. Employment, v. Government infrastructure construction etc.
It is interesting to note that the holdings composition of $XHB is divided between $XLI (47%) and $XLY (53%). However, one could argue that conventional wisdom suggests the inclusion of $XLB in the mix as well.

Thank you for taking the time to read. If you found value in this discussion, please consider sharing this with others. Cheers.
PS: If you enjoy the above curated article, you may follow me on twitter (@jeffsuntrading) to get daily market diary, trading ideas and intermittent reflection on life as a trader.
The current month has presented a challenging environment for executing breakout trades. The prevalence of frequent intraday whipsaw movements has made it difficult to effectively carry trades forward.
Throughout history, these five sectors (a combination of 64% in $SPY… pic.twitter.com/nuKy20Bahz
— Jeff Sun, CFTe (@jeffsuntrading) May 13, 2023

