
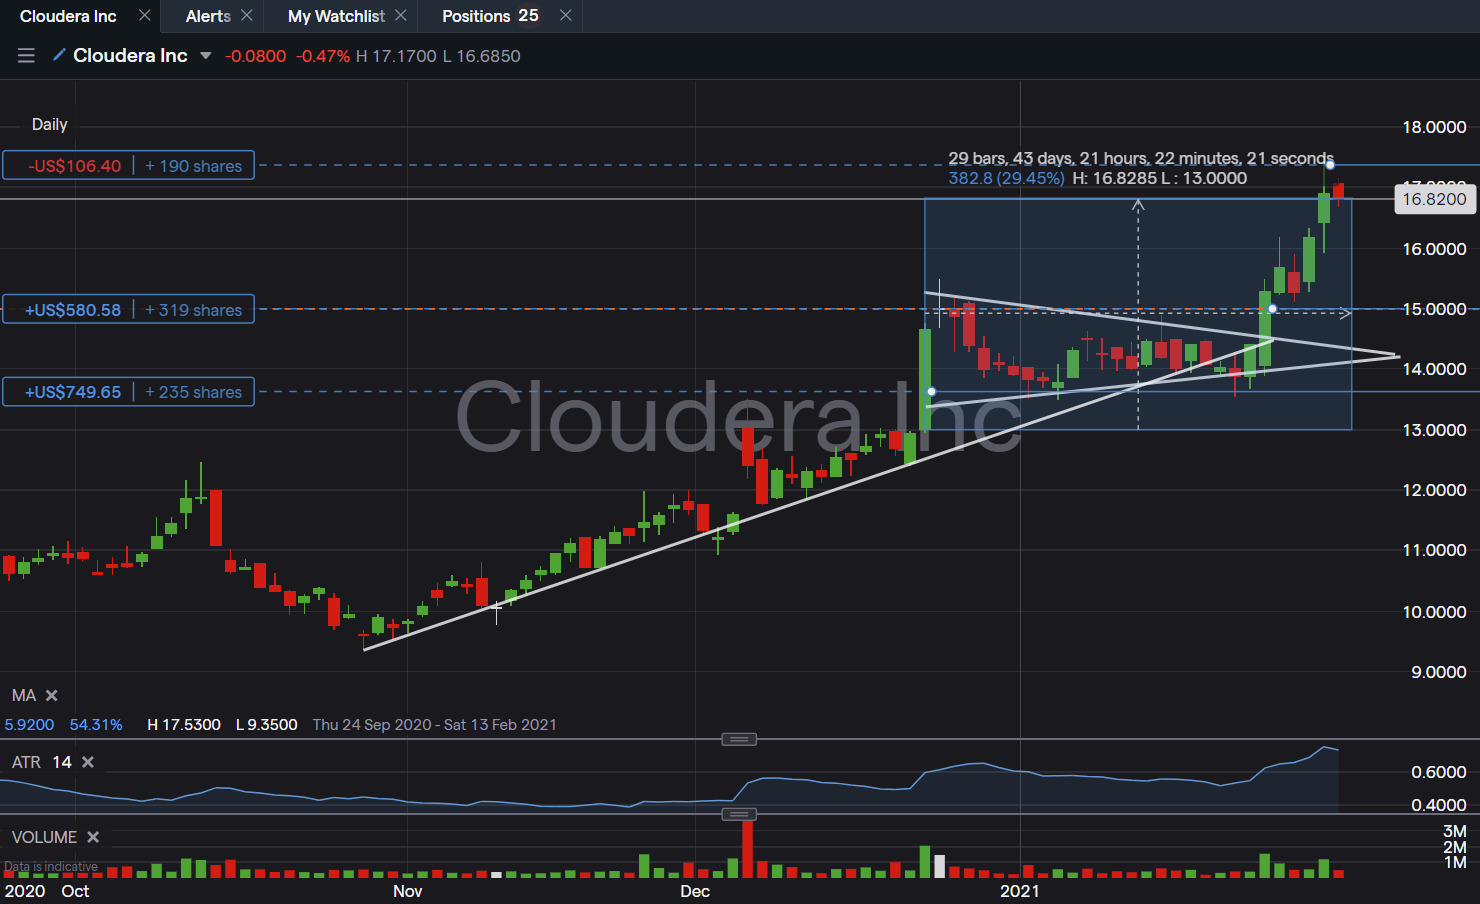
During the previous week where U.S. stock indexes suffered their biggest correction since late October 2020, $CLDR defied the market frailty via a structurally sound breakout of its Symmetrical Triangle chart pattern with substantial follow through of rally for the subsequent days. The total cumulative gain since $CLDR was highlighted on 22nd December 2020 stood at a gain of +29.45%.
With $CLDR current price volatility inching back to its September 2020 high, it will be imperative to see $CLDR re-testing its immediate resistance at $18.50 before its upcoming Q4 earnings on 10th March 2021. This resistance level was established in September of 2018.
