

It another losing week for the S&P 500 despite a 2.6% gain on Thursday following the September CPI report. In the process, the S&P 500 fell to a new low for the year, closing at 3,583.
U.S. earnings season gets underway against a background of worries that the Federal Reserve’s aggressive rate hike campaign could tip the economy into a recession. Investors will get an update on the U.S. housing market where the increase in borrowing costs has already led to cooling demand.
Elsewhere, third quarter economic data out of China is likely to underline the challenges facing the world’s number two economy.
Here’s what you need to know to start your week.
1. Earnings
Third-quarter earnings season gets underway with companies reporting results amid a challenging environment due to the stronger dollar and persistently high inflation.
Earnings for S&P 500 companies overall are expected to have climbed 4.1% from the year-earlier period, which would be the slowest growth since the fourth quarter of 2020.
But more focus may be on how executives project the future; consensus analyst estimates are for a nearly 8% rise in profits next year, according to Refinitiv IBES, but many investors are dubious of that forecast as recession risks loom.
A selloff in markets has lowered stock valuations, but a downgrade in the earnings outlook could dampen equities’ attractiveness. Companies due to report earnings in the coming week include Tesla ($TSLA), Netflix ($NFLX) and Johnson & Johnson ($JNJ).
2. Chinese data
China is to release third quarter GDP data on Tuesday and while growth is expected to rebound from the prior quarter the economy is still on track to post its slowest annual rate of growth in nearly 50 years.
The annual rate of growth is expected to pick up 3.4% in the three months to September, from 0.4% in the second quarter.
Stringent COVID-19 curbs along with supply chain disruptions caused by the war in Ukraine plus slowing global growth due to sharp increases in borrowing costs to curb inflation have weighed on the world’s second-largest economy.
Analysts expect China’s economy to grow 3.2% in 2022, well below the official target of around 5.5%.
Investors will be watching the weeklong Communist Party Congress, which got underway on Sunday for any indications on economic policy.
Key Economic Calendar (Weekly)
In the wake of last week’s hotter-than-expected U.S. inflation data focus will turn to the housing market with reports due on building permits, housing starts and existing home sales.
House prices fell for the first time in over 10 years in July as rising interest rates hit housing demand, while mortgage applications have also fallen.
The economic calendar also includes reports on industrial production, the Philly Fed Manufacturing Index, the Empire State Manufacturing Index, and initial jobless claims.
All times listed are EDT
Monday
8:30 US – Empire State Manufacturing Index: forecast to further decline from -1.5 to -4.5
Tuesday
10:00 China – GDP q/y: forecast to increase from 0.4% to 3.4%
Tuesday
8:30 US – Philly Fed Manufacturing Index: forecast to increase from -9.9 to -5.0
Top 3 Leading and Lagging Sectors (Weekly)
The hardest-hit sectors were consumer discretionary (-4.6%), technology (-4.4%), basic materials (-3.2%). Those sectors managing gains for the week includes consumer staples (+0.68%), which got help from a good report out of PepsiCo ($PEP), and health care (+0.1%).

Market Breath (Weekly)
% of Stocks Above 20 DMA = 34.90% (+28.73%)
% of Stocks Above 50 DMA = 18.33% (+1.05%)
% of Stocks Above 200 DMA = 21.29% (+0%)


Market Technicals – (S&P 500, NASDAQ, Bitcoin, Bonds & Credit Spread, NAAIM)

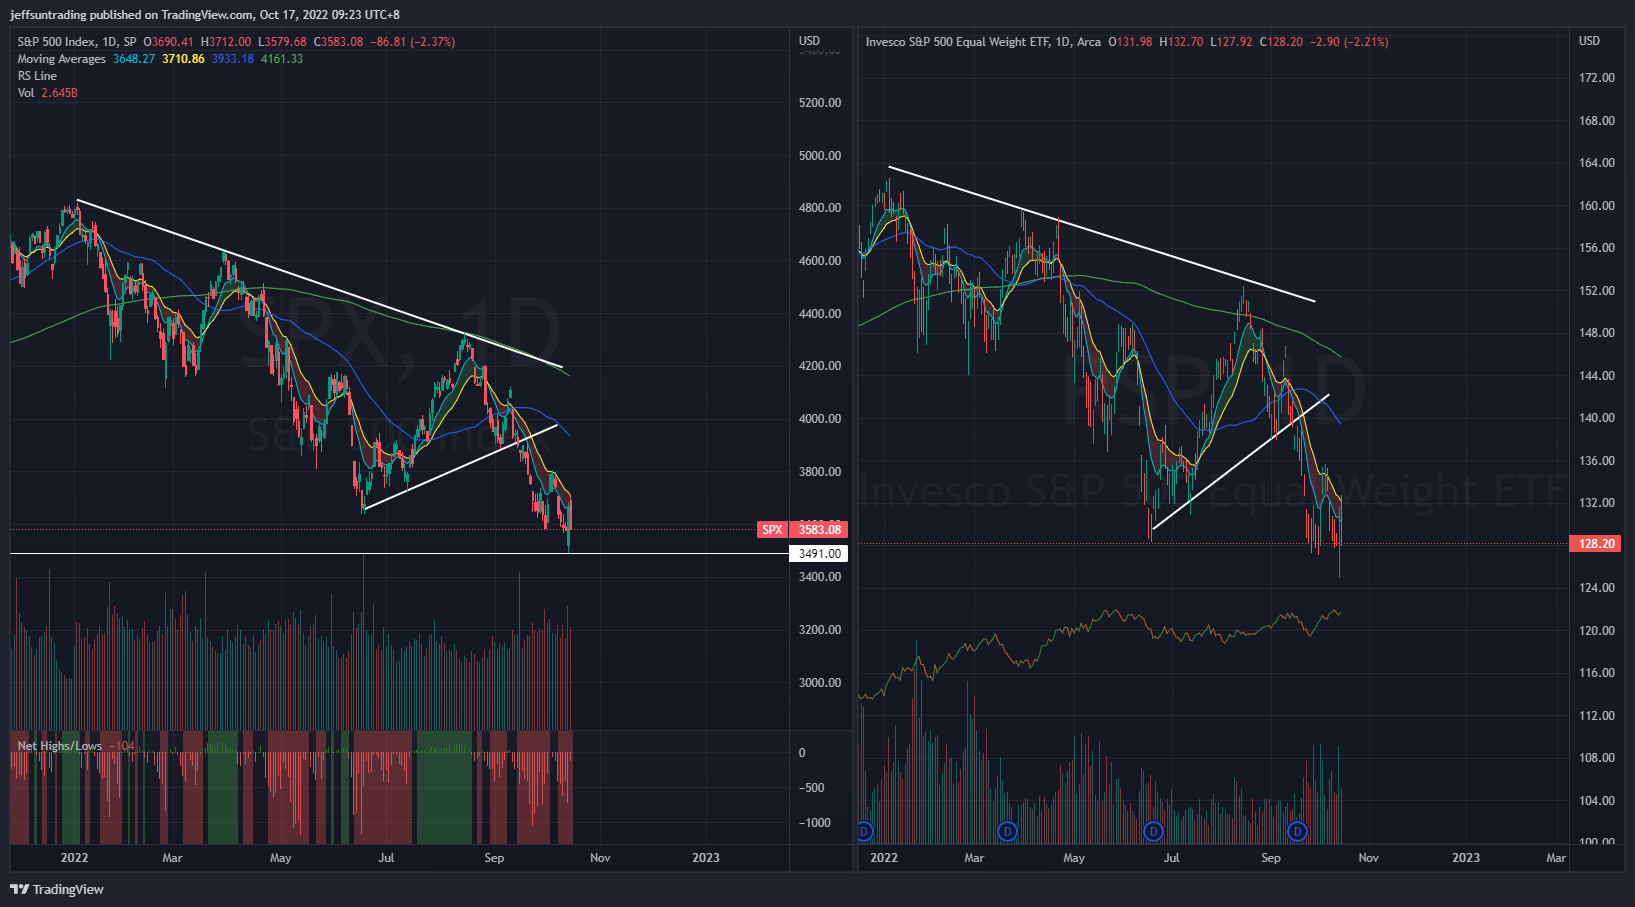
$SPX (S&P 500) vs $RSP (S&P 500 Equal Weight) – (Net High/Low -104)
A hard landing for the economy was a prominent concern for market participants as the central banks ramped up their fight against inflation. It led to broad-based selling, rooted in worries that there will soon be large cuts to earnings estimates. Accordingly, there was a reticence to pay up for stocks and an inclination to take risk off the table.
$SPX gave up its midweek gain with attempts to rally beyond its declining 20-day moving average, and finished the week lower (-1.55%).
At the current juncture, $SPX remains below all major moving averages, and resisted to its declining 10/20-day moving averages.
The support to watch for this week is at 3,490 level, a breakdown of the lowest level established last week.
Bull Case: Reclaim above 3,950 50-day moving average level.
Bear Case: Breakdown of 3,490 level, a breakdown of the lowest level established last week. Next support at 3,400 level.

$QQQ (Nasdaq 100) vs $QQQE (Nasdaq 100 Equal Weight) – Higher Treasury Yields To Continue Painful Transition For Stocks
Tech and growth names have been hard hit since the start of 2022 by a rapid rise in Treasury yields on the back of expectations that the Fed will hike interest rates aggressively to combat high inflation as higher rates can hurt their companies with high valuations based on the prospect of future profits.
$QQQ declined -3.11% for the week, remaining as the weakest major index year to date with -34% return.
Similar to $SPX, $QQQ is trading beyond its year to date low, remaining below all major moving averages in declining fashion. $QQQ is also resisted to its declining 10/20-day moving average at the moment.
The support level to watch for $QQQ this week is at 254 level, a breakdown of the lowest level established last week.
Bull Case: Reclaim above 298 50-day moving average.
Bear Case: Breakdown of 254 level, a breakdown of the lowest level established last week. The next support level is at 230.

$BTCUSD (Bitcoin / USD) – Bearish Pennant Forming Below 10/20-Day Moving Average
Bitcoin declined -0.93% for the week. $BTCUSD remains below its declining 10 & 20 day-moving average. Similarly, long term moving averages such as 200-day and 50-day are all in declining fashion.
$BTCUSD’s Bearish Pennant pattern remains in play, a consolidated price action behavior that may prompt a further sell off in near term.
The level of support to watch for $BTCUSD this week remains at $18,157, the lowest level of the previous month before reaching its year till date low $17,590.
Bull Case: Reclaim above its existing 50-day moving averages at $20,000.
Bear Case: Breakdown of $18,157, a immediate support before reaching its year till date low $17,590.

$PCCE (Put/Call Ratio Equity) & $VIX (Volatility S&P 500) – Persistence in Reflection of Imminent Major Sell Off Ahead
VIX >30 is assumed to accompany large volatility, resulting from increased uncertainty, risk, and investor fear. VIX <20 generally correspond to stable, stress-free periods in the market. Higher VIX levels equates to more expensive options premium and vice versa for lower VIX level.
The spike level to watch for $PCCE in the last 24 months period is at 1.00. The current reading is 0.864 (-13.10%).
Conversely, the VIX volatility index, also known as Wall Street’s fear gauge increased to 32.01 (+2.11%).
The weekly build up in momentum of both $PCCE and $VIX is reflecting a major sell off remains imminent for the equities market ahead.

$VIX/VXV – Reading at 1.01 (Uncertainty)
The VIX/VXV measures the ratio between 1-month implied volatility and 3-month implied volatility, which is helpful as it filters out higher baseline readings on VIX.
- If it is greater than one, it implies uncertainty, negative for equities. On the contrary, such high reading (i.e. spikes) coincide with market bottoms.
- If it is less than one, it implies tranquility, favorable for equities.
- If it is below 0.82, the returns for S&P500 are often less than stellar.

$IEI/$HYG (Credit Spread) & $TNX (10YR Treasury Yield) – 10-Year US Treasuries Yield On Track For Year Till Date High
Market participants are keeping a close watch on credit spreads as one of the better economic signals. Junk bond issuers are perceived to be bigger credit risks, so if economic growth slows or contracts, there will be increased angst that these issuers won’t be able to make good on their interest payments. Hence, a widening high-yield spread is regarded as a leading indicator of difficult economic times which, in turn, often invites a more challenging period for the stock market since difficult economic times translate into weaker earnings prospects.
Credit Spread remains at 1.58% for the week. The year to date high level is at 1.64%, set in early July.
The 10-yr note yield ($TNX) rose further for the week to 4.01%. The 2-yr note yield rose 18bps on the week to 4.47%.

NAAIM Exposure Index 19.84 (-47.94%)
The NAAIM Exposure Index represents the average exposure to US Equity markets reported by members of the National Association of Active Investment Managers. It provides insight into the actual adjustments active risk managers have made to client accounts over the past two weeks. The blue line depicts a two-week moving average of the NAAIM managers’ responses.
This week’s NAAIM Exposure Index number is: 19.84 (Wednesday)
Top Trading Ideas for the Week
$PDCE$PRTA$CEIX$CROX#Trading #MomentumLeaders #RelativeStrength #TradingView #jsTradingIdeas pic.twitter.com/zOrrrrrrrR
— Jeff Sun, CFTe (@jeffsuntrading) October 16, 2022
Do follow me on twitter for more daily trading ideas.