

The equity market had a strong start to the week. There was a broad rally on Monday and Tuesday as the market bought into the idea that the Fed would soften its approach sometime soon. However, sell off resumed in the final day of trading as rates pop after September jobs report The 10-yr note yield rose 8 basis point on the week to 3.88%. The 2-yr note yield rose 10bps on the week to 4.30%. Notably, the stock market was able to hang onto some of its gains this week despite heavy losses on Friday. The S&P 500 was up 1.5%; the Dow Jones Industrial Average was up 2.0%; the Nasdaq Composite was up 0.7%.
The latest U.S. inflation numbers on Thursday will be keenly awaited by investors who have repeatedly had their hopes dashed for a pivot away from an aggressive rate hike campaign by the Federal Reserve. Wednesday’s minutes of the latest Fed meeting should offer some insights into how officials view the economy and the inflation outlook. Big bank earnings on Friday are expected to show the impact of rising interest rates and market volatility. Oil prices will remain in the spotlight after OPEC+ announced its largest supply cut since 2020.
Here’s what you need to know to start your week.
1. Big bank earnings
Big U.S. banks are to kick off quarterly corporate earnings on Friday amid concerns over the impact of rising interest rates. Four of the nation’s largest lenders – JPMorgan Chase ($JPM), Wells Fargo ($WFC), Citigroup ($C), and Morgan Stanley ($MS) – are due to report third-quarter earnings ahead of Friday’s open.
Analysts expect the results to show a slide in net income after market volatility hit investment banking activity and lenders set aside more rainy-day funds to cover losses from borrowers who fall behind on their payments.
Banks typically earn more when interest rates rise because they can charge customers more to borrow, but higher borrowing costs also impact on demand for mortgages and other loans.
2. Oil prices
Oil prices look likely to remain in the spotlight after rallying to five-week highs on Friday, despite the stronger dollar, after OPEC+’s decision to cut oil production in the face of stiff U.S. pressure to keep global oil prices down.
The Organization of the Petroleum Exporting Countries and allies including Russia, known as OPEC+, plans to lower their output target by 2 million barrels per day ahead of a European Union embargo on Russian oil, pressuring supply in an already tight market.
Key Economic Calendar (Weekly)
Wednesday’s FOMC Meeting Minutes will provide more insights into policymakers’ view of where inflation stands and the outlook for the future path of interest rates. Recent comments by Fed officials have indicated that turbulence in financial markets would not deter them from acting to lower inflation, which by the central bank’s preferred measure is running at more than three times its target.
Another elevated inflation reading on Thursday CPI data would underline the case for even more hawkishness from the Fed after Friday’s jobs report indicated that the labor market remains robust despite the Fed’s efforts to bring down high inflation by weakening growth.
Retail sales data on Friday is expected to show a modest increase for September as auto sales rebounded.
All times listed are EDT
Wednesday
8:30 US – PPI m/m: forecast to increase from -0.1% to 0.2%
14:00 US – FOMC Meeting Minutes
Thursday
8:30 US – CPI m/m: forecast to increase from 10.1% to 0.2%
Friday
8:30 US – Retail Sales m/m: forecast to decline from 0.3% to 0.2%
10:00 US – Prelim UoM Consumer Sentiment: forecast to increase from 58.6 to 59.1
Top 3 Leading and Lagging Sectors (Weekly)
The surge in oil prices contributed to the S&P 500 energy sector’s gains this week. It outpaced the other 11 sectors by a wide margin with a gain of 11.13%. On the flip side, the real estate sector had the biggest loss this week, down 3.21%.

Market Breath (Weekly)
% of Stocks Above 20 DMA = 27.11% (+158.19%)
% of Stocks Above 50 DMA = 18.14% (+54.25%)
% of Stocks Above 200 DMA = 21.29% (+28.25%)


Market Technicals – (S&P 500, NASDAQ, Bitcoin, Bonds & Credit Spread, NAAIM)

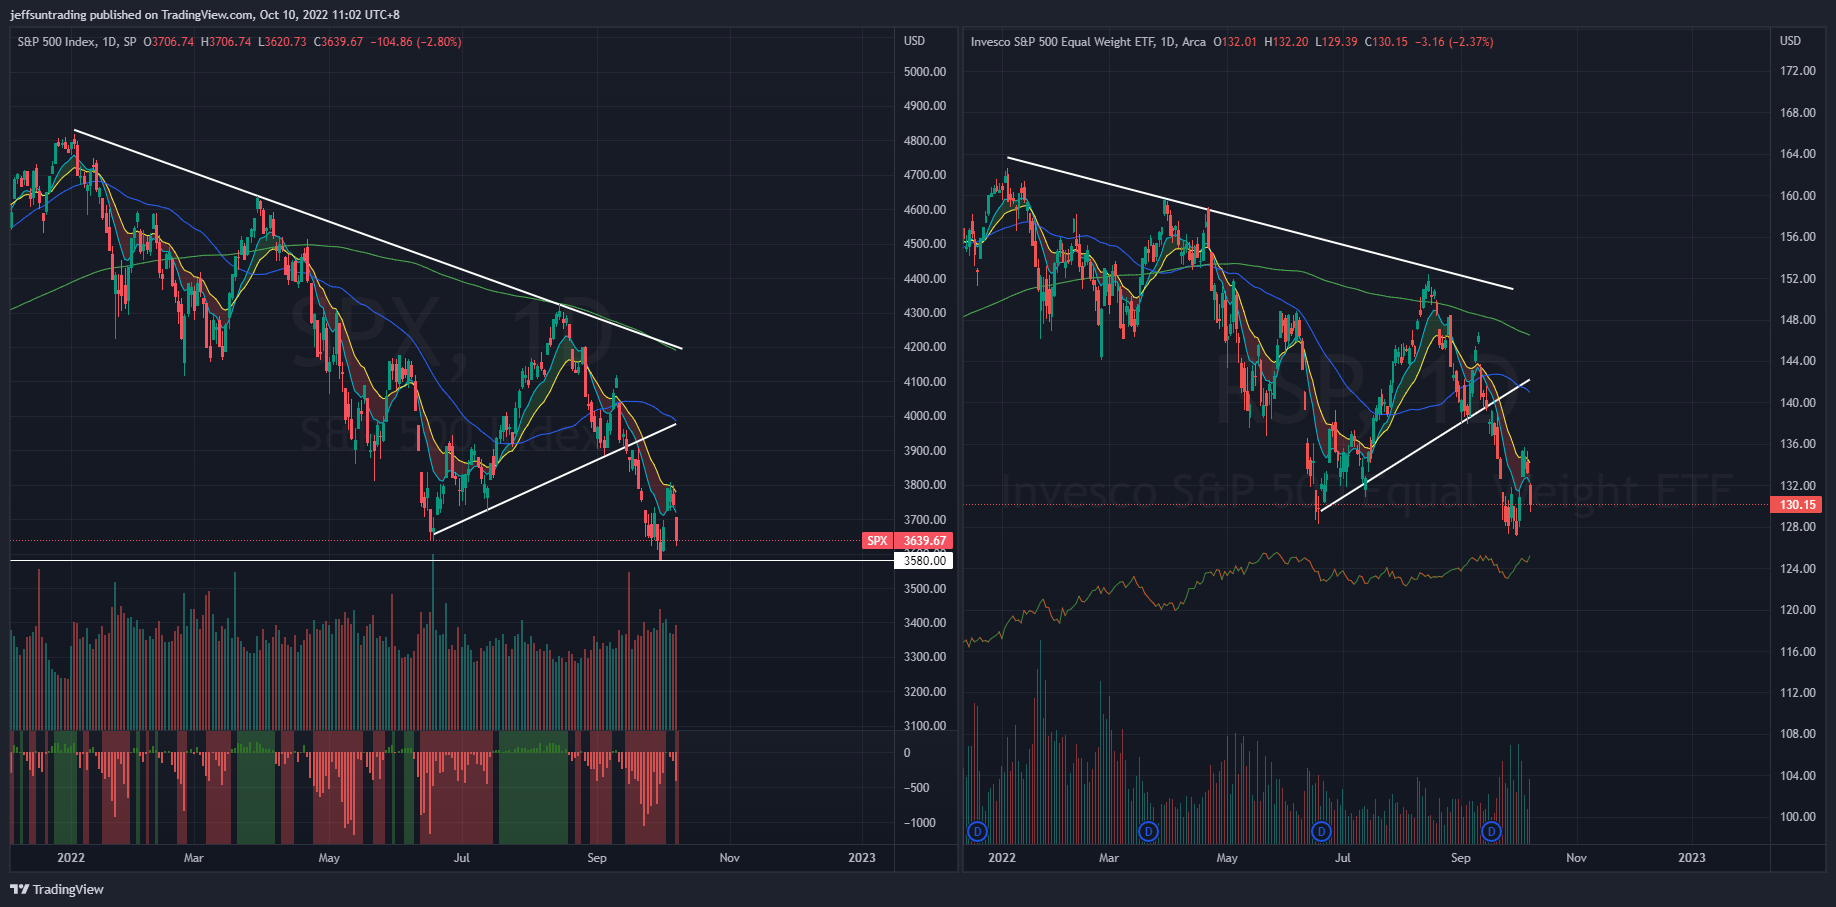
$SPX (S&P 500) vs $RSP (S&P 500 Equal Weight) – (Net High/Low -399)
A hard landing for the economy was a prominent concern for market participants as the central banks ramped up their fight against inflation. It led to broad-based selling, rooted in worries that there will soon be large cuts to earnings estimates. Accordingly, there was a reticence to pay up for stocks and an inclination to take risk off the table.
$SPX notched a +1.51% gain for the week, with attempts to rally beyond its declining 20-day moving average during the broad rally at the start of the week.
At the current juncture, $SPX remains below all major moving averages, and resisted to its declining 10/20-day moving averages.
The support to watch for this week is at 3,580 level, a breakdown of the lowest level of the year.
Bull Case: Reclaim above 4,000 50-day moving average level.
Bear Case: Breakdown of 3,580 level, a breakdown of the lowest level of the year. next support at 3,400 level.

$QQQ (Nasdaq 100) vs $QQQE (Nasdaq 100 Equal Weight) – Higher Treasury Yields To Continue Painful Transition For Stocks
Tech and growth names have been hard hit since the start of 2022 by a rapid rise in Treasury yields on the back of expectations that the Fed will hike interest rates aggressively to combat high inflation as higher rates can hurt their companies with high valuations based on the prospect of future profits.
$QQQ lodged a modest gain of +0.69% for the week, remaining as the weakest major index year to date with -31.9% return.
Similar to $SPX, $QQQ is trading beyond its year to date low, remaining below all major moving averages in declining fashion. $QQQ is also resisted to its declining 10/20-day moving average at the moment.
The support level to watch for $QQQ this week is at 267 level, the lowest level year to date.
Bull Case: Reclaim above 302 50-day moving average.
Bear Case: Breakdown of 267 level, the lowest level year to date. The next support level is at 230.

$BTCUSD (Bitcoin / USD) – Bearish Pennant Forming Below 10/20-Day Moving Average
Bitcoin gain +2.07% for the week, coupled with a strong rally on Tuesday but eventually faded off to the closing week. $BTCUSD remains below its declining 10 & 20 day-moving average. Similarly, long term moving averages such as 200-day and 50-day are all in declining fashion.
$BTCUSD’s Bearish Pennant pattern remains in play, a consolidated price action behavior that may prompt a further sell off in near term.
The level of support to watch for $BTCUSD this week remains at $18,157, the lowest level of the previous month before reaching its year till date low $17,590.
Bull Case: Reclaim above its existing 50-day moving averages at $20,000.
Bear Case: Breakdown of $18,157, a immediate support before reaching its year till date low $17,590.

$PCCE (Put/Call Ratio Equity) & $VIX (Volatility S&P 500) – Persistence in Reflection of Imminent Major Sell Off Ahead
VIX >30 is assumed to accompany large volatility, resulting from increased uncertainty, risk, and investor fear. VIX <20 generally correspond to stable, stress-free periods in the market. Higher VIX levels equates to more expensive options premium and vice versa for lower VIX level.
The spike level to watch for $PCCE in the last 24 months period is at 1.00. The current reading of 0.995 (+6.58%), increased from the previous week reflects a a likelihood of a continual sell off from Friday’s session.
Conversely, the VIX volatility index, also known as Wall Street’s fear gauge declined to 31.35 (-0.82%).
The weekly build up in momentum of both $PCCE and $VIX is reflecting a major sell off remains imminent for the equities market ahead.

$VIX/VXV – Reading at 1.02 (Uncertainty)
The VIX/VXV measures the ratio between 1-month implied volatility and 3-month implied volatility, which is helpful as it filters out higher baseline readings on VIX.
- If it is greater than one, it implies uncertainty, negative for equities. On the contrary, such high reading (i.e. spikes) coincide with market bottoms.
- If it is less than one, it implies tranquility, favorable for equities.
- If it is below 0.82, the returns for S&P500 are often less than stellar.

$IEI/$HYG (Credit Spread) & $TNX (10YR Treasury Yield) – 10-Year US Treasuries Yield On Track For Year Till Date High
Market participants are keeping a close watch on credit spreads as one of the better economic signals. Junk bond issuers are perceived to be bigger credit risks, so if economic growth slows or contracts, there will be increased angst that these issuers won’t be able to make good on their interest payments. Hence, a widening high-yield spread is regarded as a leading indicator of difficult economic times which, in turn, often invites a more challenging period for the stock market since difficult economic times translate into weaker earnings prospects.
Credit Spread present a subtle decline to 1.58% (-0.01) for the week. The year to date high level is at 1.64%, set in early July.
The 10-yr note yield ($TNX) rose 8 basis point on the week to 3.88%. The 2-yr note yield rose 10bps on the week to 4.30%.

NAAIM Exposure Index 38.11 (+202.2%)
The NAAIM Exposure Index represents the average exposure to US Equity markets reported by members of the National Association of Active Investment Managers. It provides insight into the actual adjustments active risk managers have made to client accounts over the past two weeks. The blue line depicts a two-week moving average of the NAAIM managers’ responses.
This week’s NAAIM Exposure Index number is: 38.11 (Wednesday)
Top Trading Ideas for the Week
$CCRN$SG$RYTM$MIR#Trading #MomentumLeaders #RelativeStrength #TradingView #jsTradingIdeas pic.twitter.com/2SISBCa3hH
— Jeff Sun, CFTe (@jeffsuntrading) October 9, 2022
Do follow me on twitter for more daily trading ideas.