

Markets snapped a 3-week losing streak as investors piled into tech and growth stocks that have been battered on concerns about the impact of tighter monetary policies on the economy. The S&P 500 closed up 3.6% in the first full week of the month and the NASDAQ Composite jumping 4.1%, while the Dow Jones Industrial Average climbed only 2.7%.
With the summer over and earnings season in its quietest moments, there are two key software companies reporting results that are worth watching. The economic calendar in the US will be dominated by inflation rate figures which should provide further clues on the Fed’s tightening path. Near-term downtrends for indexes also remained intact as they failed to be violated even with the week’s gain.
Here’s what you need to know to start your week.
1. $ORCL & $ADBE Key Earnings Reports
Software giant Oracle ($ORCL) reports Monday after the close, and is expected to show 4% earnings growth in its first quarter including newest acquisition Cerner ($CERN). Oracle received a recent price target upgrade from a Global Equities analyst in light of the Cerner deal, as well as a buy rating from Guggenheim, but like many in the software and tech industry, has been adjusting to a more difficult macro environment, as the company has been reported to have started lay-offs. So the earnings report and conference call may be revealing.
Adobe Systems ($ADBE) reports Thursday after the market close. The company is expected to post 7.3% earnings growth and 12.6% revenue growth. The company disappointed in its prior report but the share price has since more than recovered. Adobe’s role as one of the original software companies that transitioned successfully to a SaaS (software as a service) model makes its report a useful bellwether.
2. Russia-Ukraine Developments and Aftershocks
Ukraine’s surprising recapture of the city of Izium in the country’s northeast has caught observers’ attention around the world as a potential turning point in the war. Ukraine is also attacking Russian positions in the south of the country, near Kherson, and should they be able to maintain an attack on two fronts and take and hold territory, it would mark a different tone.
Russia has continued to escalate economic pressure on Europe with the shutting down of the Nord Stream 1 gas pipeline. While the military landscape is shifting and uncertain, it is not hard to imagine that Russian setbacks could only increase Russia’s willingness to use its economic leverage with Ukraine and with Ukraine’s supporters in predictable and unpredictable ways, which could put more pressure on European countries to resolve their energy situation before the winter arrives.
Key Economic Calendar (Weekly)
The US August inflation report will be the most closely watched event as it will be a market mover in the coming week knowing that it will shape the market’s perspective on the inflation trend and the Fed’s potential response to it. The annual inflation rate is seen slowing to 8.1% from 8.5% while the monthly consumer price index may fall by 0.1%, the first decline since May 2020.
Investors will also keep a close on US retail sales data for clues about the behavior of American consumers on the back of sky-high inflation. Other important releases in the US calendar include the producer price index and the University of Michigan sentiment index.
All times listed are EDT
Tuesday
8:30 US – CPI m/m: forecast to decrease from 0.0% to -0.1%
Wednesday
8:30 US – PPI m/m: forecast to increase from -0.5% to -0.1%
Thursday
8:30: US – Core Retail Sales m/m: forecast to decrease from 0.4% to 0.1%
Friday
10:00 US – Prelim University of Michigan Consumer Sentiment: forecast to increase from 58.2 to 59.8
Top 3 Leading and Lagging Sectors (Weekly)
All 11 S&P 500 sectors registered gains for the week ranging from 1.1% (consumer defensive) to 5.8% (basic materials). Four sectors gained at least 3.0%.

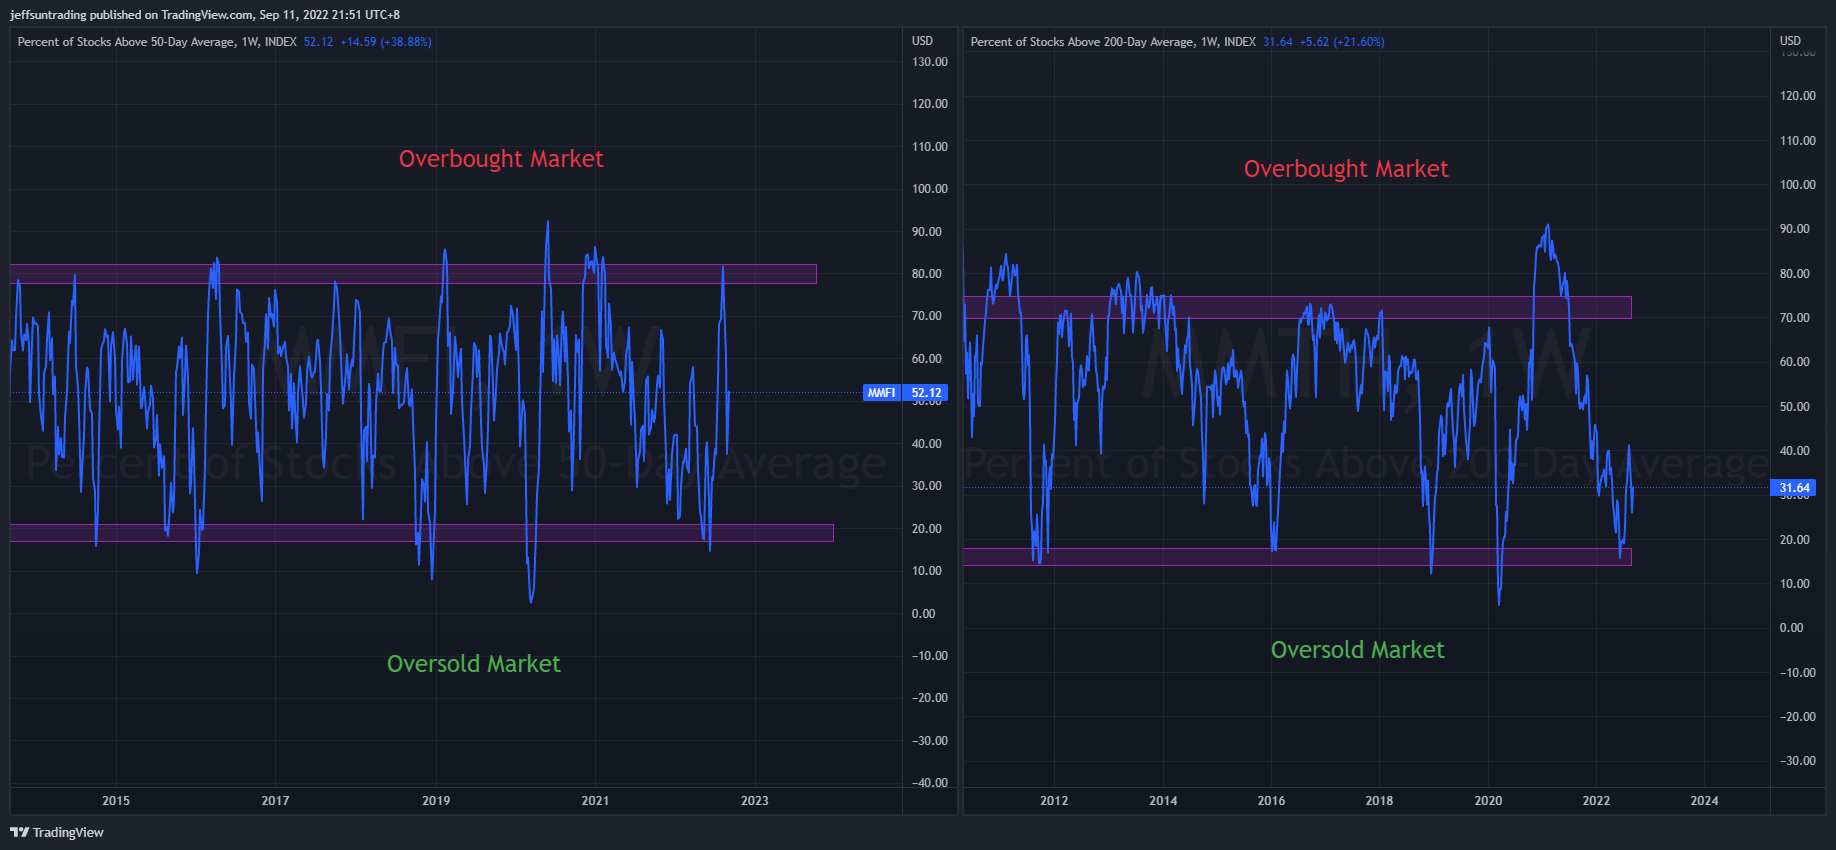
Market Breath (Weekly)
% of Stocks Above 20 DMA = 36.96% (+163.25%)
% of Stocks Above 50 DMA = 52.12% (+38.88%)
% of Stocks Above 200 DMA = 31.64% (+21.60%)


Market Technicals – (S&P 500, NASDAQ, Bitcoin, Bonds & Credit Spread, NAAIM)

$SPX (S&P 500) vs $RSP (S&P 500 Equal Weight) – (Net High/Low +17)
The stock market came into this shortened week of trading on a three-week losing streak. It looked on Tuesday as if that streak might be extended to four weeks, but there was an abrupt turn in sentiment that powered a strong move in the major indices over the last three sessions from 3,900 support level. The losing streak was eventually broken and both the $SPX and $QQQ had reclaimed a posture back above their 50-day moving averages.
The resilience to selling efforts in the face of negative developments has fostered a sense that the market has priced in the near-term rate hikes already after enduring three, consecutive weeks of losses. At Tuesday’s low, the $SPX was down 10.1% from the intraday high it saw on August 16, so there has been an added sense that the market had gotten oversold and was due for a technical bounce.
At the current juncture, the mid-term downtrend remains intact as $SPX remains trading below its declining 200-day moving average, and AVWAP from all time high.
The support to watch for this week remains at 3,900 level, the recent lowest level.
Bull Case: Reclaim above 4,212 AVWAP from all time high. Immediate resistance at declining 200-day moving average and downtrend line.
Bear Case: Breakdown of 3,900 recent low. next support at 3,800.

$QQQ (Nasdaq 100) vs $QQQE (Nasdaq 100 Equal Weight) – Seasonal Headwind Suggested By 10 Years Data
Tech and growth names have been hard hit since the start of 2022 by a rapid rise in Treasury yields on the back of expectations that the Fed will hike interest rates aggressively to combat high inflation as higher rates can hurt their companies with high valuations based on the prospect of future profits.
$QQQ remains as the weakest major index year to date with -22.6% return, even after posting the strongest weekly gain of +4.04% among the major indexes.
It is worth to note that based on the past 10 years data, $QQQ has declined by an average of -0.6% in September—the only month of the year with a negative return.
The support level to watch for $QQQ this week remains at 292, the recent low.
Bull Case: Reclaim above 333 AVWAP from all time high. Immediate resistance at declining 200-day moving average.
Bear Case: Breakdown of 292, the recent low. The next support level is at 280.

$BTCUSD (Bitcoin / USD) – Reclaiming 10/20-Day Moving Average Is a First Sign Of Strength
Bitcoin ($BTCUSD +7.52%) rebounded from $18,900 support level reclaiming posture above its 10/20-day moving average. It is worth to note that $BTCUSD is now trading beneath its declining 50-day moving average.
The level of support to watch for $BTCUSD this week remains at $18,900, a immediate support before reaching its year till date low $17,590.
Bull Case: Reclaim above its existing 50-day moving averages at $22,000.
Bear Case: Breakdown of $18,900, a immediate support before reaching its year till date low $17,590.

$PCCE (Put/Call Ratio Equity) & $VIX (Volatility S&P 500) – Persistence in Reflection of Imminent Major Sell Off Ahead
VIX >30 is assumed to accompany large volatility, resulting from increased uncertainty, risk, and investor fear. VIX <20 generally correspond to stable, stress-free periods in the market. Higher VIX levels equates to more expensive options premium and vice versa for lower VIX level.
The spike level to watch for $PCCE in the last 24 months period is at 1.00. The current reading of 0.830 (-16.87%) remains elevated and poses likelihood and risk of accelerated selling for the month of September
With the improved standing of the stock market, the VIX volatility index, also known as Wall Street’s fear gauge fell 10.53% to 22.78.
The weekly build up in momentum of both $PCCE and $VIX is reflecting a major sell off remains imminent for the equities market ahead.

$VIX/VXV – Reading at 0.89 (Tranquility)
The VIX/VXV measures the ratio between 1-month implied volatility and 3-month implied volatility, which is helpful as it filters out higher baseline readings on VIX.
- If it is greater than one, it implies uncertainty, negative for equities. On the contrary, such high reading (i.e. spikes) coincide with market bottoms.
- If it is less than one, it implies tranquility, favorable for equities.
- If it is below 0.82, the returns for S&P500 are often less than stellar.

$IEI/$HYG (Credit Spread) – $TNX (10YR Treasury Yield) – 10-Year US Treasuries Yield On Track For Year Till Date High
Market participants are keeping a close watch on credit spreads as one of the better economic signals. Junk bond issuers are perceived to be bigger credit risks, so if economic growth slows or contracts, there will be increased angst that these issuers won’t be able to make good on their interest payments. Hence, a widening high-yield spread is regarded as a leading indicator of difficult economic times which, in turn, often invites a more challenging period for the stock market since difficult economic times translate into weaker earnings prospects.
Credit Spread slimmer to 1.55% (-0.04) for the week. The year to date high level is at 1.64%, set in early July.
The 2-yr note yield climbed 17 basis points this week to 3.57% while the 10-yr note yield ($TNX) jumped 12 basis points to 3.32% (year to date high is at 3.48%). Those moves came mostly on Tuesday with a flood of corporate issuance weighing on the market along with festering angst about the Fed stepping up efforts this month to reduce the size of its balance sheet.

NAAIM Exposure Index 27.33 (-15.54%)
The NAAIM Exposure Index represents the average exposure to US Equity markets reported by members of the National Association of Active Investment Managers. It provides insight into the actual adjustments active risk managers have made to client accounts over the past two weeks. The blue line depicts a two-week moving average of the NAAIM managers’ responses.
This week’s NAAIM Exposure Index number is: 27.33
Top Trading Ideas for the Week
$LULU – Consumer Cyclical | Apparel Retail
breakout of year long bullish wedge pattern, retaking its 200MA, AVWAP from ATH and YTDH with higher lows since late may’22.
latest ER on 1/9 reports continual YoY growth for both EPs (+33%) and Sales (+29%) pic.twitter.com/yb1DJVvDeF
— Jeff Sun, CFTe (@jeffsuntrading) September 9, 2022
$ACVA – Consumer Cyclical | Auto & Truck Dealerships
pretty sure none of us gonna miss this trade if it breaks pic.twitter.com/zknBFOWklE
— Jeff Sun, CFTe (@jeffsuntrading) September 8, 2022
$PAYO the only one in my watchlist that remains in green for the day pic.twitter.com/RcYLb3A7bI
— Jeff Sun, CFTe (@jeffsuntrading) August 30, 2022

