

Markets in the US are closed on Monday for Labour Day holiday.
For the week, the major indices registered losses between 3.0-4.7%. It was the third straight losing week. The catalyst for a lot of the selling interest was an acknowledgment by Fed officials that the fed funds rate should be somewhat above 4.00% by early next year and there is no anticipation of a rate cut in 2023. The stance is aligned with Fed Chair Powell’s tough minded policy speech two weeks ago at Jackson Hole. Worries about the European energy crisis also added burden to the Market on Friday.
The escalating energy row between Moscow and the West is set to occupy investors’ attention in the week ahead after Moscow vowed to keep its main gas pipeline to Germany shut. Federal Reserve Chair Jerome Powell is due to make an appearance before the central bank goes into its blackout period before its next meeting. OPEC+ is meeting Monday to discuss cutting output to support oil prices.
Here’s what you need to know to start your week.
1. Energy row
The standoff over Russian gas and oil exports escalated Friday after Moscow vowed to keep its main gas supply pipeline to Germany shuttered and G7 countries announced a planned price cap on Russian oil exports aimed at hitting Russian resources to fight the war in Ukraine.
The latest Nord Stream pipeline shutdown, which Russia says will last for as long as it takes to carry out repairs, added to fears of winter gas shortages that could pull major economies into recession and lead to energy rationing.
Europe has accused Russia of weaponizing energy supplies in what Moscow has called an “economic war” with the West in the wake of Russia’s invasion of Ukraine. Moscow blames Western sanctions and technical issues for supply disruptions.
The European Commission has warned that a full cut-off of Russian gas supplies to Europe, if combined with a cold winter, could reduce GDP across the European Union by as much as 1.5% if countries did not prepare in advance.
2. Fed Chair Speaks
Fed Chair Jerome Powell is to speak at a Cato Institute conference on Thursday and investors will be on the lookout for any indications that the Fed is leaning towards another 75-basis-point rate hike at its September 20-21 meeting or whether a 50-basis-point hike may be on the cards.
Friday’s employment report for August was a mixed bag – while the economy added more jobs than expected, wage growth moderated and the unemployment rate ticked higher, keeping alive the debate over the size of the next Fed hike.
Expectations for aggressive Fed action have solidified since a hawkish speech by Powell at the Fed’s Jackson Hole conference last month.
3. OPEC+ meeting
The Organization of the Petroleum Exporting Countries and allies, including Russia, is due to meet on Monday and energy traders will be paying close attention after Saudi Arabia recently raised the possibility of production cuts.
Surging energy costs this year have plagued global economies as Russia’s invasion of Ukraine exacerbated supply concerns.
Oil prices have eased over the summer amid uncertainty over the demand outlook from China’s COVID-19 curbs and as central banks around the world hiked interest rates to combat soaring inflation, weighing on the global economic outlook.
OPEC+ last week revised market balances for this year and now sees demand lagging supply by 400,000 barrels per day, against 900,000 bpd forecast previously. The producer group expects a market deficit of 300,000 bpd in its base case for 2023.
Key Economic Calendar (Weekly)
The economic calendar is light, but the Institute for Supply Management publishes its August ISM services PMI on Tuesday, with economists expecting a reading of 55.5.
All times listed are EDT
Tuesday
10:00 US – ISM Services PMI: forecast to decrease from 56.7 to 55.0
Thursday
9:10: US – Fed Chair Powell Speaks at a Cato Institute conference
Top 3 Leading and Lagging Sectors (Weekly)
All 11 S&P 500 sectors finished lower for the week with losses ranging from 2% to 6.72%. The defensive-oriented utilities sector was the “best-performing” sector. Growth stocks saw the biggest hit this week with the jump in long-term rates, but value stocks also saw their fair share of selling.

Market Breath (Weekly)
% of Stocks Above 50 DMA = 37.53% (-38.32%)
% of Stocks Above 200 DMA = 26.02% (-19.99%)

Market Technicals – (S&P 500, NASDAQ, Bitcoin, Bonds & Credit Spread, NAAIM)

$SPX (S&P 500) vs $RSP (S&P 500 Equal Weight) – (Net High/Low -154)
All three main indexes posted their third straight weekly loss, with the Dow down 2.99%, the S&P 500 falling 3.29% and the Nasdaq shedding 4.21%. They have all also undercut their VWAP from 2022 low.
A summer rally in stock markets has taken a hit since Powell’s hawkish-sounding speech at Jackson Hole, where he warned that the Fed’s fight against inflation could result in economic pain.
The support to watch for this week is at 3,900 level, the recent week lowest level.
Bull Case: Reclaim above 4,225 AVWAP from all time high. Immediate resistance at declining 200-day moving average and downtrend line.
Bear Case: Breakdown of 3,900 recent week low. next support at 3,800.

$QQQ (Nasdaq 100) vs $QQQE (Nasdaq 100 Equal Weight) – Seasonal Headwind Suggested By 10 Years Data
Tech and growth names have been hard hit since the start of 2022 by a rapid rise in Treasury yields on the back of expectations that the Fed will hike interest rates aggressively to combat high inflation as higher rates can hurt their companies with high valuations based on the prospect of future profits.
$QQQ remains as the weakest major index year to date with -25.7% return. $QQQ posted a further weekly loss of -3.99%, breaking down from its month long bearish rising wedge pattern that was highlighted last week. It is also worth to note that $QQQ is losing steam on its relative strength against $SPX that was noticed in May.
$QQQ has declined by an average of -0.6% in September—the only month of the year with a negative return based on the past 10 years data.
The support level to watch for $QQQ this week is at 292, the recent week low.
Bull Case: Reclaim above 333 AVWAP from all time high. Immediate resistance at declining 200-day moving average.
Bear Case: Breakdown of 292, the recent week low. The next support level is at 280.

$BTCUSD (Bitcoin / USD) – Bitcoin Breaking Down From Its Second Bearish Flag
Bitcoin ($BTCUSD +1.57%) continues display drifting action as $BTCUSD short term moving averages have transited to a declining mode, as it trades below its 10-day moving average.
The level of support to watch for $BTCUSD this week remains at $18,900, a immediate support before reaching its year till date low $17,590.
Bull Case: Reclaim above its existing 10/20/50-day moving averages at $22,500.
Bear Case: Breakdown of $18,900, a immediate support before reaching its year till date low $17,590.

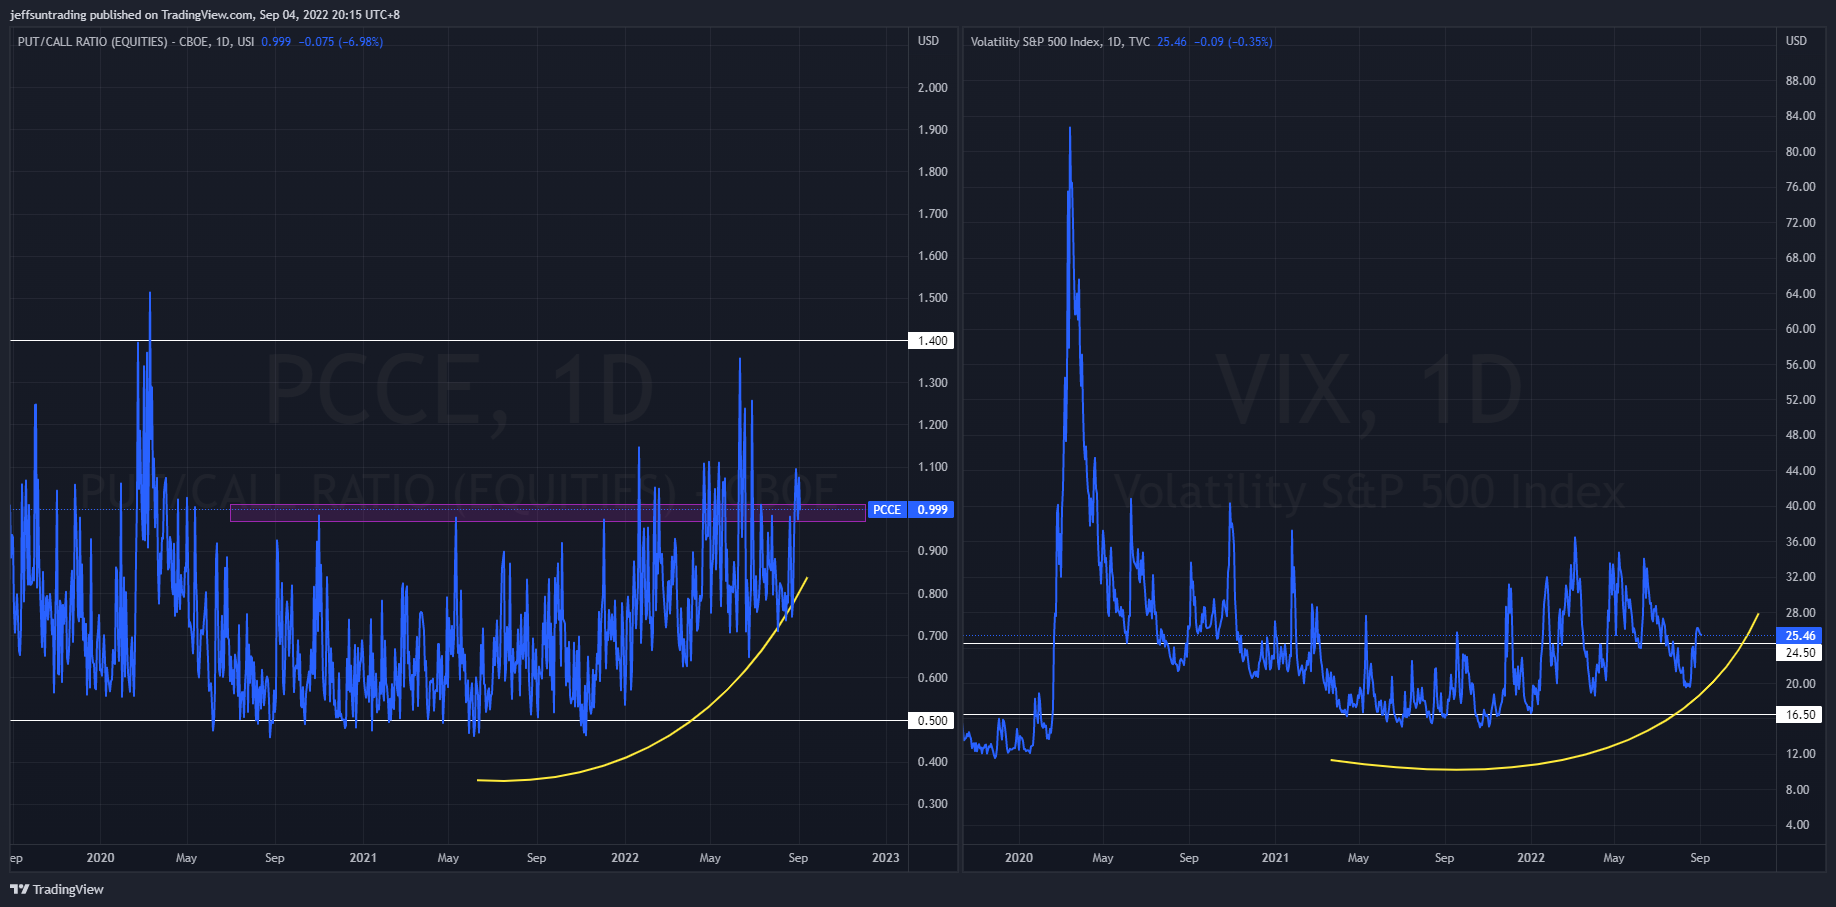
$PCCE (Put/Call Ratio Equity) & $VIX (Volatility S&P 500) – Persistence in Reflection of Imminent Major Sell Off Ahead
VIX >30 is assumed to accompany large volatility, resulting from increased uncertainty, risk, and investor fear. VIX <20 generally correspond to stable, stress-free periods in the market. Higher VIX levels equates to more expensive options premium and vice versa for lower VIX level.
The spike level to watch for $PCCE in the last 24 months period is at 1.00. The current reading of 0.999 (+7.76%) remains elevated and poses likelihood and risk of accelerated selling for the month of September
Conversely, the VIX volatility index, also known as Wall Street’s fear gauge has an insignificant declined to 25.46 (-0.35%). Volatility looks set to remain elevated when traders return after the long Labor Day weekend on Tuesday, with investors shifting their attention to U.S. inflation data due mid-month, the final piece of major economic data before the Fed’s September meeting.
The weekly build up in momentum of both $PCCE and $VIX is reflecting a major sell off remains imminent for the equities market ahead.

$VIX/VXV – Reading at 0.96 (Tranquility)
The VIX/VXV measures the ratio between 1-month implied volatility and 3-month implied volatility, which is helpful as it filters out higher baseline readings on VIX.
- If it is greater than one, it implies uncertainty, negative for equities. On the contrary, such high reading (i.e. spikes) coincide with market bottoms.
- If it is less than one, it implies tranquility, favorable for equities.
- If it is below 0.82, the returns for S&P500 are often less than stellar.

$IEI/$HYG (Credit Spread) – $TNX (10YR Treasury Yield) – 10-Year US Treasuries Yield On Track For Year Till Date High
Market participants are keeping a close watch on credit spreads as one of the better economic signals. Junk bond issuers are perceived to be bigger credit risks, so if economic growth slows or contracts, there will be increased angst that these issuers won’t be able to make good on their interest payments. Hence, a widening high-yield spread is regarded as a leading indicator of difficult economic times which, in turn, often invites a more challenging period for the stock market since difficult economic times translate into weaker earnings prospects.
Credit Spread edged up further to 1.59% (+0.02) for the second time in a row. The year to date high level is at 1.64%, set in early July.
The 2-yr note yield slipped one basis point for the week to 3.40% but the 10-yr note yield ($TNX) jumped 16 basis points to 3.20%. The year to date high is at 3.48% that was set in June.

NAAIM Exposure Index 32.36 (-41.01%)
The NAAIM Exposure Index represents the average exposure to US Equity markets reported by members of the National Association of Active Investment Managers. It provides insight into the actual adjustments active risk managers have made to client accounts over the past two weeks. The blue line depicts a two-week moving average of the NAAIM managers’ responses.
This week’s NAAIM Exposure Index number is: 32.36
Top Trading Ideas for the Week
$TOST still trapped below VWAP from ATH but relatively resilient still.
consolidating within a triangle and sitting along its rising 10/20 MAs with RS pic.twitter.com/ReY7gS0fCW
— Jeff Sun, CFTe (@jeffsuntrading) September 1, 2022
$PAYO the only one in my watchlist that remains in green for the day pic.twitter.com/RcYLb3A7bI
— Jeff Sun, CFTe (@jeffsuntrading) August 30, 2022
$ASAI – Consumer Defensive | Grocery Stores
quite a clean chart but what puts me off is its avg daily vol at below 750k. bound to suffer slippages on entry and exit execution pic.twitter.com/OoWJClSxbP
— Jeff Sun, CFTe (@jeffsuntrading) August 30, 2022

