
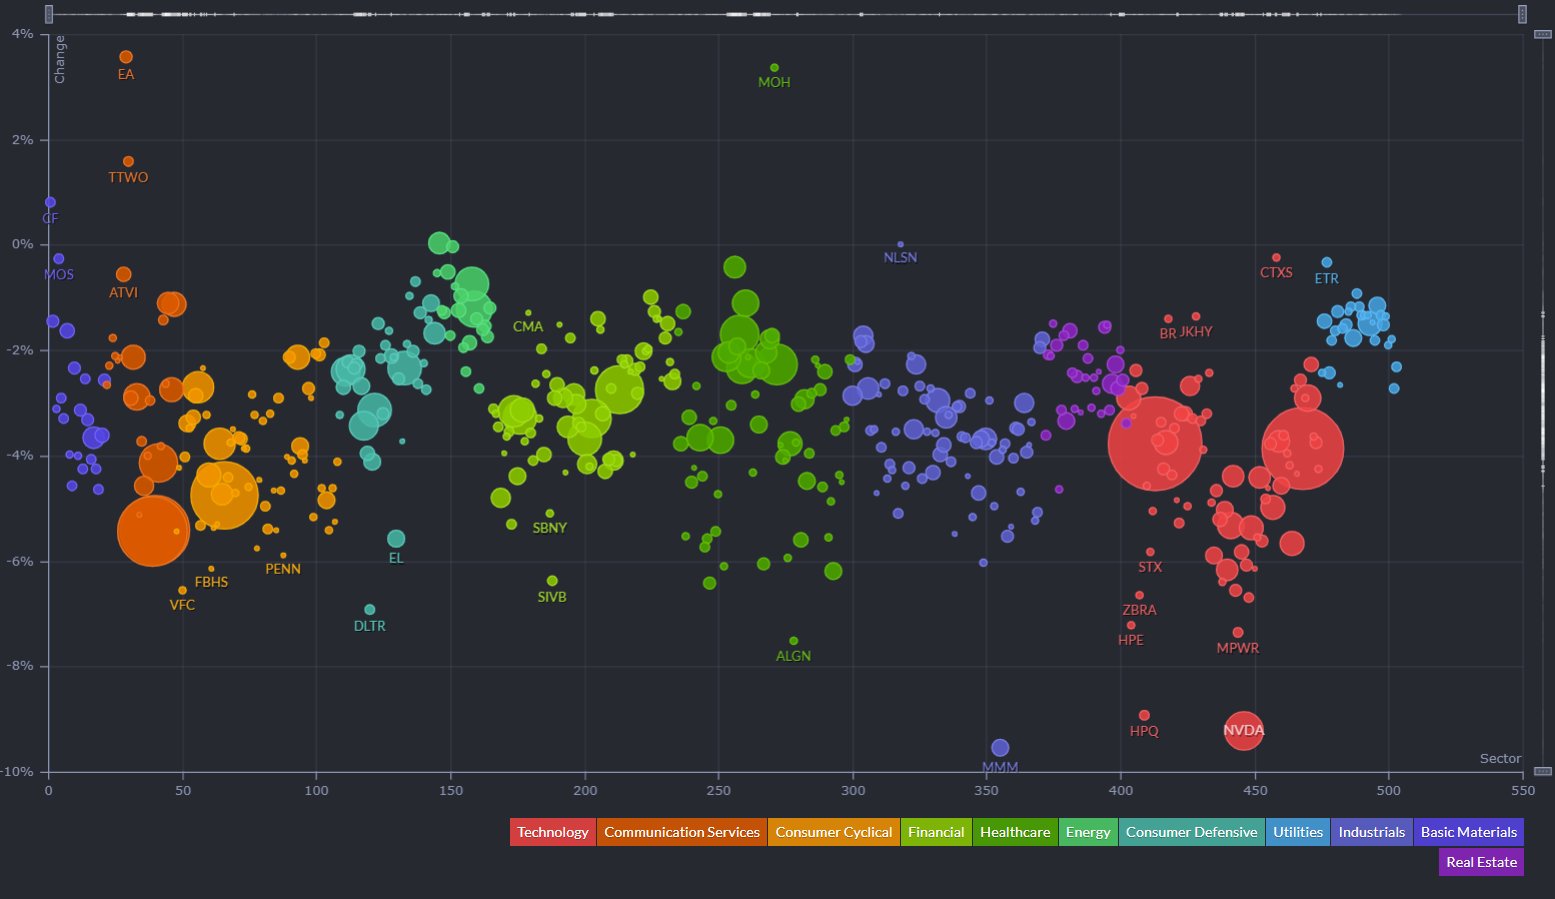
I have started doing a daily S&P 500 bubble graph updates to pick out the strongest momentum S&P stocks within the outperforming sector on my twitter @jeffsuntrading


The major indexes are all down over -4.0% for the week as market sold off sharply on Friday following a short speech from Fed Chair Powell who indicated that another large increase in the interest rate could be appropriate. The only gainers of note on the week were the oil prices (+3.0%), the S&P 500 energy sector (+4.3%), the U.S. Dollar Index (+0.6%), and the 30-yr bond (-2 bps to 3.21%).
With the Federal Reserve firmly committed to raising interest rates to tame inflation, even at the cost of a decline in economic growth, investors will be focusing on Friday’s August jobs report for an indication of strength in the labor market. U.S. equity market investors will continue to reposition after Friday’s steep selloff, which erased all of August’s modest gains.
Here’s what you need to know to start your week.
Key Economic Calendar (Weekly)
Several economic releases will be in spotlight, the biggest of which will be the US non-farm payrolls report as market watchers are trying to figure out whether the central bank can pull off an economic slowdown without triggering a recession as it battles to tame inflation.
Ahead of Friday’s jobs data the U.S. is set to release a report on JOLTs Job Openings for July on Tuesday, with economists expecting job openings to remain high, pointing towards still solid demand in the labor market.
Also, in focus will be the ADP Employment Change and the ISM manufacturing PMI.
All times listed are EDT
Tuesday
10:00 US – CB Consumer Confidence: forecast to increase from 95.7 to 97.4
10:00 US – JOLTS Jobs Openings: forecast to decease from 10.70M to 10.43M
Wednesday
8:15: US – ADP Non-Farm Employment Change: forecast to increase from 128K to 310K
Thursday
10:00: US – ISM Manufacturing PMI: forecast contraction of 52.8K to 52.1K
Friday
8:30: US – Non-Farm Employment Change: forecast to decrease from 528K to 295K
8:30: US – Unemployment Rate: forecast to remain at 3.5%
Top 3 Leading and Lagging Sectors (Weekly)
The only gainers for the week were the energy (+4.36%) and basic materials sector (+0.80%). Biggest losers were on technology (-5.00%), communication services (-4.61%) and real estate (-3.6%) sectors.

Market Breath (Weekly)
% of Stocks Above 50 DMA = 60.85% (-17.24%)
% of Stocks Above 200 DMA = 32.52% (-11.34%)

Market Technicals – (S&P 500, NASDAQ, Bitcoin, Bonds & Credit Spread, NAAIM)

$SPX (S&P 500) vs $RSP (S&P 500 Equal Weight) – (Net High/Low -105)
Wall Street ended Friday with all three benchmarks down more than 4% as investors absorbed Fed Chair Jerome Powell’s Jackson Hole speech.
$SPX continue its second week of decline (-4.04%) as $SPX ran into a confluence of resistance highlighted over last two week;
- its declining 200MA,
- trend channel resistance,
- major support turned resistance all within 4,300 – 4,350 range, and
- extension in % of stocks above 20MA and 50MA at their extreme levels
The $SPX was in a bear market after plunging in the first half of the year as investors priced in aggressive Fed rate hikes, but the index has rebounded since June, recouping half its losses for the year. The rebound has been fueled by a combination of strong corporate earnings and optimism that inflation may have peaked, which would allow the Fed to slow rate hikes. But with hopes of a dovish pivot from the Fed now on ice, markets could be in for a bumpy ride going into September.
The support to watch for this week is at 3,970 level, a level that coincides with its rising 50-day moving average and AVWAP from June’s low.
Bull Case: Reclaim above 4,225 AVWAP from all time high. Immediate resistance at declining 200-day moving average and downtrend line.
Bear Case: Breakdown of 3,970 rising 50-day moving age and AWVAP from June’s low. next support at 3,800.

$QQQ (Nasdaq 100) vs $QQQE (Nasdaq 100 Equal Weight) – Playing Out Bearish Rising Wedge, Losing Steam on Relative Strength against $SPX
Tech and growth names have been hard hit since the start of 2022 by a rapid rise in Treasury yields on the back of expectations that the Fed will hike interest rates aggressively to combat high inflation as higher rates can hurt their companies with high valuations based on the prospect of future profits.
$QQQ remains as the weakest major index year to date with -22.4% return. $QQQ posted a further weekly loss of -4.10%, breaking down from its month long bearish rising wedge pattern that was highlighted last week. It is also worth to note that $QQQ is losing steam on its relative strength against $SPX that was noticed in May.
The support level to watch for $QQQ this week is at 300, a level that coincides with its rising 50-day moving average and AVWAP from June’s low.
Bull Case: Reclaim above 335 AVWAP from all time high. Immediate resistance at declining 200-day moving average.
Bear Case: Breakdown of 300, a level that coincides with its rising 50-day moving average and AVWAP from June’s low.

$BTCUSD (Bitcoin / USD) – Bitcoin Breaking Down From Its Second Bearish Flag
Bitcoin ($BTCUSD -9.10%) broke down further from the highlighted mini bear flag within its second successive bearish flag formation. $BTCUSD short term moving averages have transited to a declining mode, provoking a intraday sell off after resisting price penetration on 26/8/2022
The level of support to watch for $BTCUSD this week is at $18,900, a immediate support before reaching its year till date low $17,590.
Bull Case: Reclaim above its existing 10/20/50-day moving averages at $22,500.
Bear Case: Breakdown of $18,900, a immediate support before reaching its year till date low $17,590.

$PCCE (Put/Call Ratio Equity) & $VIX (Volatility S&P 500) – Persistence in Reflection of Imminent Major Sell Off Ahead
VIX >30 is assumed to accompany large volatility, resulting from increased uncertainty, risk, and investor fear. VIX <20 generally correspond to stable, stress-free periods in the market. Higher VIX levels equates to more expensive options premium and vice versa for lower VIX level.
The spike level to watch for $PCCE in the last 24 months period is at 1.00. The current reading of 0.927 (+3.16%) remains elevated and poses likelihood and risk of accelerated selling for the month of August.
Previously, the VIX volatility index, also known as Wall Street’s fear gauge has declined for eight consecutive weeks, the longest streak in the last three years. For the second consecutive week, it surged up to 25.55 (+24.09%).
The weekly build up in momentum of both $PCCE and $VIX is reflecting a major sell off remains imminent for the equities market ahead.

$VIX/VXV – Reading at 1.06 (Week of Uncertainty)
The VIX/VXV measures the ratio between 1-month implied volatility and 3-month implied volatility, which is helpful as it filters out higher baseline readings on VIX.
- If it is greater than one, it implies uncertainty, negative for equities. On the contrary, such high reading (i.e. spikes) coincide with market bottoms.
- If it is less than one, it implies tranquility, favorable for equities.
- If it is below 0.82, the returns for S&P500 are often less than stellar.

$IEI/$HYG (Credit Spread) – $TNX (10YR Treasury Yield) – US Treasuries Held its Ground
Market participants are keeping a close watch on credit spreads as one of the better economic signals. Junk bond issuers are perceived to be bigger credit risks, so if economic growth slows or contracts, there will be increased angst that these issuers won’t be able to make good on their interest payments. Hence, a widening high-yield spread is regarded as a leading indicator of difficult economic times which, in turn, often invites a more challenging period for the stock market since difficult economic times translate into weaker earnings prospects.
Credit Spread edged up further to 1.56% (+0.02) after five successive weeks of contraction, since setting a high of 1.62% at the end of June.
U.S. Treasuries which had already been under pressure at the thought of a more hawkish-minded Fed, held its ground better in the wake of Mr. Powell’s speech. The 2-yr note yield rose just one basis point to 3.40% and the 10-yr note also rose just one basis point to 3.04%. They were up 15 basis points and five basis points for the week, respectively. When the month started, the 2-yr note yield stood at 2.90% and the 10-yr note yield stood at 2.64%.

NAAIM Exposure Index 54.86 (-14.87%)
The NAAIM Exposure Index represents the average exposure to US Equity markets reported by members of the National Association of Active Investment Managers. It provides insight into the actual adjustments active risk managers have made to client accounts over the past two weeks. The blue line depicts a two-week moving average of the NAAIM managers’ responses.
This week’s NAAIM Exposure Index number is: 54.86
Top Trading Ideas for the Week
$DQ posted triple digit YoY growth on both eps and revs in its latest ER. latest close (+7.98%) is a BO of a 6 weeks consolidation, showing true signs of RS when broad market had its biggest sell off since june.
immediate resistance at $74.15 pic.twitter.com/uypUF707eX
— Jeff Sun, CFTe (@jeffsuntrading) August 27, 2022
$LXU – Basic Materials | Chemicals
strong close (+8.5%) above VWAP from ATH, all KMAs to rising short term MAs, broke out of DTL along with a breakout at $16 pivot of a mini double bottom pattern.
up/down volume ratio at 1.3, YoY EPS and Revs remains above triple digit growth pic.twitter.com/qH0hWj1S1N
— Jeff Sun, CFTe (@jeffsuntrading) August 26, 2022
$NCLH – Consumer Cyclical | Travel
strongest among the 3 major cruise liners ($CCL & $RCL) as RS flatten since mid jun & 1st in bullish MA crossover (20dv50d)
higher lows tightening within its ascending triangle. currently near the apex of it
pivot coincides VWAP at $14.35 pic.twitter.com/y0yoSAlaDh
— Jeff Sun, CFTe (@jeffsuntrading) August 25, 2022