

The market staged a rally during the holiday-shortened week, allowing the Dow (+0.8%), S&P 500 (+1.9%), and Nasdaq (+4.6%) to reclaim the bulk of their losses from the previous week.
For this week, the headline story will be the latest set of CPI reports with analysts expecting an acceleration that will continue to hold the Federal Reserve’s feet to the fire.
Q2 earnings season also kicks off, with leading banks like JPMorgan Chase, Morgan Stanley, Wells Fargo, Citigroup and a few key S&P 500 components leading the way. Global unrest caused in part by inflation pressure has also picked up, setting us up for another hot summer week.
Here’s what you need to know to start your week.
1. Earnings Season Begins
Q2 Earnings season kicks off in full this week, with leading banks like JPMorgan Chase ($JPM), Morgan Stanley ($MS), Wells Fargo ($WFC), Citigroup ($C) all reporting. Banks traditionally open earnings season given their global perspective on economic activity. They’re also in the spotlight this year given the trends of interest rates on the one hand – rising rates normally benefit financial companies – and the looming threat of a recession on the other, which would hurt pro-cyclical companies like financials.
Several key industrial or consumer goods companies report as well. Delta Air Lines’ ($DAL) report will be watched to see if recession worries, inflation, or the build-up of travel delays is taking the air out of a post-pandemic travel recovery. Taiwan Semiconductor’s ($TSM) earnings come after a strong June revenue update, but amid concerns that the semiconductor down cycle has begun. And PepsiCo ($PEP) will report Tuesday morning; as a global snacks and beverages leader, it may offer insights into how inflation is sticking and affecting the consumer.
There has been much speculation that Q2 could be when we see companies truly take down numbers and “kitchen sink” (i.e. announce all bad news at once) the quarter given the bear market backdrop. Analysts have yet to take down estimates drastically, so that looms as the major tension point for this quarter.
Key Economic Calendar (Weekly)
June inflation data comes out this week, with most countries releasing data on Wednesday. The U.S. consumer price index is expected to show an 8.8% year over year increase and a 1.1% month over month increase, which would be accelerations from last month’s number. Gas prices and the cost of energy are expected to be the main drivers, as the average price of crude oil was 3.6% higher in June than May. The path towards consistent steep rate hikes and quantitative tightening seems fixed for the time being, with last week’s strong jobs report only bolstering the case for tighter monetary policy.
U.S. retail sales data comes out on Friday, giving investors a more hands-on take on how consumers are responding to the current economic crosswinds. Sales are expected to increase 0.8% month over month, though that number is not adjusted for inflation. The strength of the consumer has been both a driver of inflation and a buoy for bulls in the face of mixed data, and will be an interesting data point here.
All times listed are EDT
Wednesday
8:30 US – CPI m/m: predicted to edge up to 1.1% from 1.0%
Friday
8:30: US –Retail Sales m/m: predicted to increase to 0.8% from -0.3%
Top 3 Leading and Lagging Sectors (Weekly)
The communication services, consumer cyclical and technology sector gained a respective +5.9%, +5.9%, and +4.6%, distancing themselves from their mid-June lows.
Energy (-1.7%) and basic materials sector (-1.4%) were the biggest loser respectively.

Market Breath (Weekly)
% of Stocks Above 50 DMA = 38.67% (+23.31%)
% of Stocks Above 200 DMA = 19.91% (+2.58%)

Market Technicals – (S&P 500, NASDAQ, Bitcoin, Bonds & Credit Spread, NAAIM)

$SPX (S&P 500) vs $RSP (S&P 500 Equal Weight) – (Net High/Low -21)
$SPX regained most of the previous week losses (+1.94%) last week, closing just beneath a minor resistance at 3,925 level.
The market got off to a shaky start on Tuesday but recovered after finding support above lows from the previous week. The Tuesday bounce opened the door to an extension of the rebound over the coming days with sectors like communication services, consumer discretionary, and technology leading the market higher.
At the current junction, the index is trading out of its descending wedge pattern, sitting on a flattening 10/20-day moving averages. However, $RSP remains resisted by its 10/20-day moving averages, also establishing a lower high. The equal weight index reflected clarity on looming weakness in the market.
The immediate support to watch for this week remains at 3,630 level, the lowest level traded year to date.

$QQQ (Nasdaq 100) vs $QQQE (Nasdaq 100 Equal Weight) – Remains the Weakest Major Index Year To Date
Tech and growth names have been hard hit since the start of 2022 by a rapid rise in Treasury yields on the back of expectations that the Fed will hike interest rates aggressively to combat high inflation as higher rates can hurt their companies with high valuations based on the prospect of future profits.
$QQQ reverse previous week losses with a gain of +4.69% for the week, but remains as the weakest major index year to date with -25.6% return.
The support level to watch for $QQQ this week remains at $269, the lowest level traded year to date.

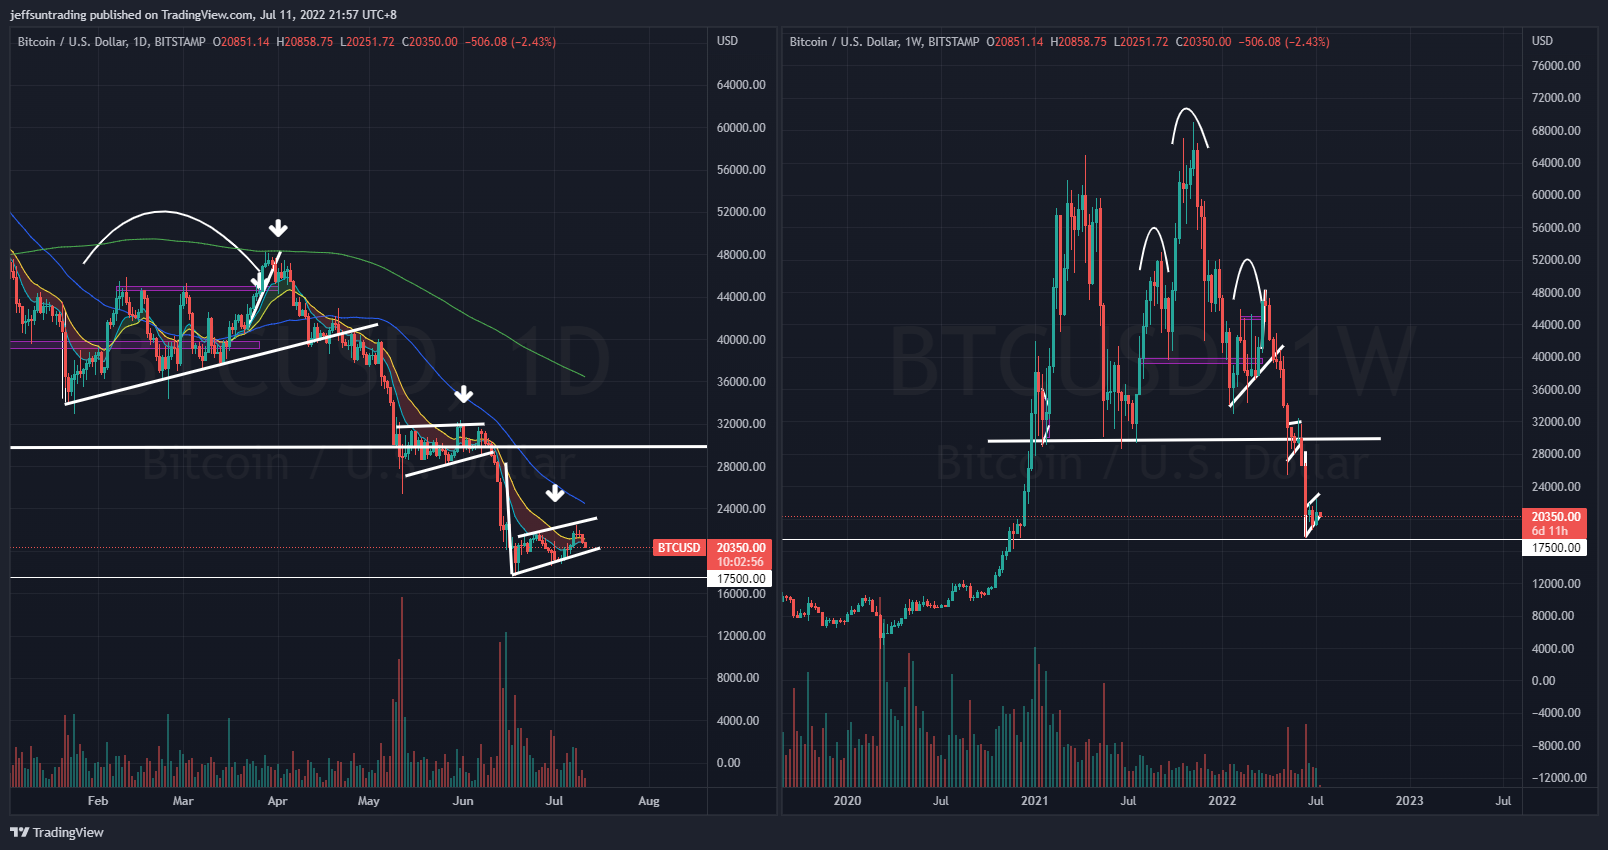
$BTCUSD (Bitcoin / USD) – Second Bearish Flag Formation For Bitcoin
Bitcoin ($BTCUSD) morphed out its second successive bearish flag formation, even with a gain of +8.09% last week.
The level of support to watch for $BTCUSD this week is at $17,500, the lowest level year to date.

$PCCE (Put/Call Ratio Equity) & $VIX (Volatility S&P 500) – Reflection of Imminent Major Sell Off Ahead
VIX >30 is assumed to accompany large volatility, resulting from increased uncertainty, risk, and investor fear. VIX <20 generally correspond to stable, stress-free periods in the market. Higher VIX levels equates to more expensive options premium and vice versa for lower VIX level.
The spike level to watch for $PCCE in the last 24 months period is at 1.00. The current reading of 0.768 (-5.24%) remains elevated and poses likelihood and risk of accelerated selling for this week.
The CBOE Volatility index ($VIX), also known as Wall Street’s fear gauge, similarly declined to 24.65 (-7.71%).
The weekly build up in momentum of both $PCCE and $VIX is reflecting a major sell off ahead remains imminent for the equities market.

$IEI/$HYG (Credit Spread) – $TNX (10YR Treasury Yield) – Highest Credit Spread Level Since November 2020
Market participants are keeping a close watch on credit spreads as one of the better economic signals. Junk bond issuers are perceived to be bigger credit risks, so if economic growth slows or contracts, there will be increased angst that these issuers won’t be able to make good on their interest payments. Hence, a widening high-yield spread is regarded as a leading indicator of difficult economic times which, in turn, often invites a more challenging period for the stock market since difficult economic times translate into weaker earnings prospects.
Credit Spread further edge down to 1.59% (-0.04) after setting a high of 1.62% last week as the volatility in the equity market resumes. This was the highest spread level since November 2020.
Treasuries gave back the bulk of their gains from the week before, lifting the 10-yr yield back above its 50-day moving average (3.003%). The benchmark yield increased by 21 bps to 3.10% for the week while the 2-yr yield rose 29 bps to 3.12%, inverting the 2s10s spread once again.

NAAIM Exposure Index 27.85 (-9.17%)
The NAAIM Exposure Index represents the average exposure to US Equity markets reported by members of the National Association of Active Investment Managers. It provides insight into the actual adjustments active risk managers have made to client accounts over the past two weeks. The blue line depicts a two-week moving average of the NAAIM managers’ responses.
This week’s NAAIM Exposure Index number is: 27.85
Top Trading Ideas for the Week
$DUOL – Technology | Software – Application
key for me in this general market weakness is to look for RS within sector -> name. technology is one of the top 3 performing sector over 2 weeks and $DUOL have displayed RS high YTD.
currently basing beneath IPO VWAP & 200D MA pic.twitter.com/Sr4ovdVszR
— Jeff Sun, CFTe (@jeffsuntrading) July 8, 2022
$GTLB – Technology | Software – Application
another tech name; resilient in RS, trading to its rising 10/20 MAs, based at $32 major support since March. have reported stable, increasing qtr sales number since IPO.
currently trading just beneath its IPO VWAP, similar to $DUOL pic.twitter.com/4MKrTK8QMJ
— Jeff Sun, CFTe (@jeffsuntrading) July 8, 2022
$BMBL – Technology | Software – Application
probably the weakest of the lot I shared today as this only came to my attention today.
but anything with YTD RS high, above all KMA with 3 months base pattern will definitely be in my WL. pic.twitter.com/tI9Ejt5XgI
— Jeff Sun, CFTe (@jeffsuntrading) July 8, 2022

