

The market began last week on an apprehensive note, due in part to hesitation ahead of the Wednesday’s release of June CPI (which showed a 1.3% month-over-month increase that lifted the yr/yr growth rate to 9.1%, a level not seen since late 1981). In addition, concerns about global growth continued weighing on sentiment. The week ended with a rebound that lifted the S&P 500 off its lowest level in nearly four weeks. Still, the benchmark index surrendered -0.9% for the week while the Nasdaq (-1.6%) underperformed and the Dow (-0.2%) finished with a slimmer loss for the week.
Corporate earnings step to the center stage this week. Last week’s bank earnings saw mixed results, and the CPI report overshoot and subsequent Federal Reserve back and forth over the size of the next interest rate hike swamped any individual company news.
With less economic data in the U.S. that will directly affect Fed policymaking, and companies like Tesla, Netflix, Verizon, J&J, and Bank of America all reporting, earnings may have a bigger impact.
Here’s what you need to know for the week ahead.
1. Blue Chips Earnings
Several blue-chip heavyweights are on tap to share earnings news this week.
Bank of America Corp ($BAC) and Goldman Sachs Group Inc ($GS) report earnings Monday morning to round out the major money center banks, coming after JPMorgan ($JPM) sounded a cautionary note and Citigroup Inc ($C) revived market optimism.
Johnson & Johnson ($JNJ) and Novartis AG ADR ($NVS) report Tuesday, with both healthcare companies outperforming the market year to date.
AT&T Inc ($T) reports on Thursday and Verizon Communications Inc ($VZ) follows on Friday, as telecoms have acted as a safe haven so far this year.
Philip Morris International Inc ($PM) (Thursday), Union Pacific ($UNP) (Thursday), American Express ($AXP) (Friday), HCA ($HCA) (Friday), and Schlumberger ($SLB) (Friday) all are also due to report.
The obvious things to watch are how companies are coping with inflation, whether they are seeing slowing economic activity, and whether this quarter will see “kitchen sink” efforts to take certain charges or losses, or to just lower expectations given the overall market wariness.
2. Tech Earnings
Expectations have already been lowered for many big-name tech companies who report earnings this week, and investors questions will be more geared towards whether the worst is past.
Netflix ($NFLX), reporting Tuesday after market hours, exemplifies this challenge, as the streaming giant has seen its shares drop nearly 70% year to date, the worst performance in the S&P 500. Q1 earnings showed both a post-pandemic hangover and a management team not sure what was next, so investors will watch for any sign of a clear direction.
Snap ($SNAP) reports Thursday after market hours and has been a canary in the coal mine for digital advertising, and so may have an outsized effect on overall markets again.
Tesla ($TSLA) reports on Wednesday, and will be closely scrutinized after a rare quarter-over-quarter drop in deliveries.
ASML Holding’s ($ASML) report on Wednesday will add the latest key data point to whether the semiconductor sector is starting to slow.
Twitter ($TWTR) will report earnings Friday morning; while they won’t be hosting a conference call given the pending acquisition by Elon Musk, and the report should not have any direct impact on the company’s litigation against Musk, it will be closely watched all the same.
Key Economic Calendar (Weekly)
All times listed are EDT
Friday
9:45: US –Flash Services PMI m/m: predicted to decrease to 51.6% from 52.7%
Top 3 Leading and Lagging Sectors (Weekly)
10 out of 11 sectors were on losing ground with communication services (-4%), basic materials (-3.29%) and energy (-3.07%) leading the losses.
Consumer non-discretionary is the only sector that outperformed, irking out a gain of +0.01%

Market Breath (Weekly)
% of Stocks Above 50 DMA = 37.35% (-3.41%)
% of Stocks Above 200 DMA = 18.99% (-4.62%)

Market Technicals – (S&P 500, NASDAQ, Bitcoin, Bonds & Credit Spread, NAAIM)

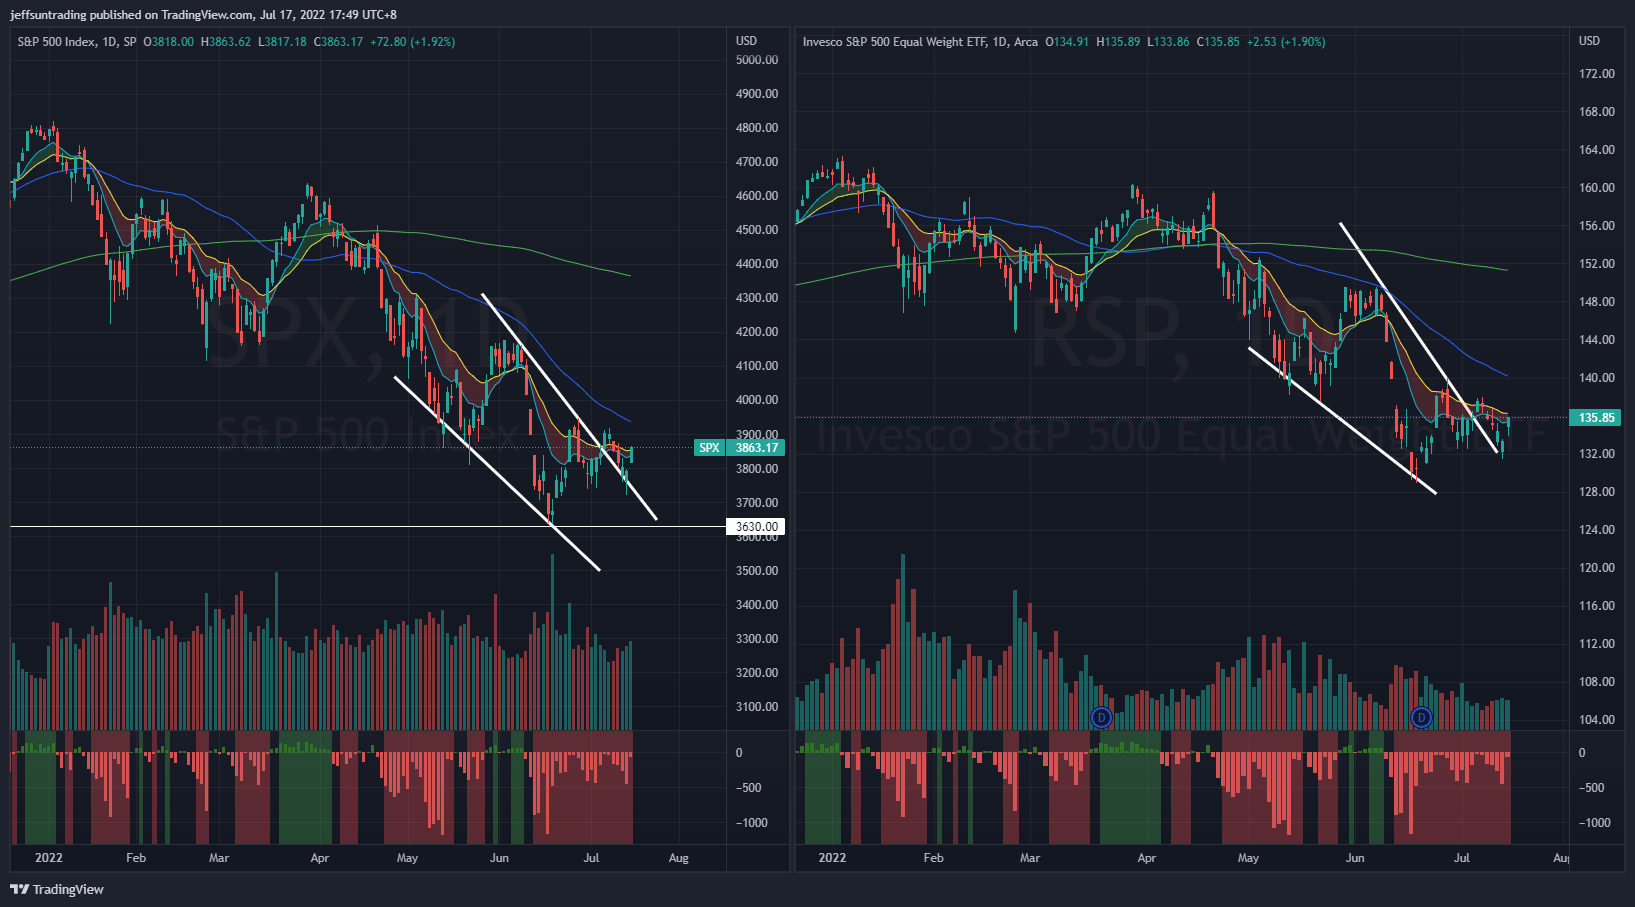
$SPX (S&P 500) vs $RSP (S&P 500 Equal Weight) – (Net High/Low -56)
$SPX surrendered -0.93% last week, whipsawing around its short term 10/20-day moving averages over the last three weeks.
The market began the week on an apprehensive note, due in part to hesitation ahead of Wednesday’s release of June CPI. In addition, concerns about global growth continued weighing on sentiment.
At the current junction, the index remains trading out of its bullish descending wedge pattern, recapturing its flattening 10/20-day moving averages. However, $RSP remains resisted by its 10/20-day moving averages, also establishing a lower high. The equal weight index reflected clarity on looming weakness in the market.
The immediate support to watch for this week remains at 3,630 level, the lowest level traded year to date.

$QQQ (Nasdaq 100) vs $QQQE (Nasdaq 100 Equal Weight) – Remains the Weakest Major Index Year To Date, But Relative Strength Observed
Tech and growth names have been hard hit since the start of 2022 by a rapid rise in Treasury yields on the back of expectations that the Fed will hike interest rates aggressively to combat high inflation as higher rates can hurt their companies with high valuations based on the prospect of future profits.
$QQQ remains as the weakest major index year to date with -26.8% return. $QQQ posted a weekly loss of -1.18% for the week. However, it is observed that $QQQ is reflecting relative strength against $SPX since 25th May, At the current juncture, $QQQ is trading within a month long Bullish Ascending Triangle pattern.
The support level to watch for $QQQ this week remains at $269, the lowest level traded year to date. The breakout level of the highlighted Ascending Triangle Pattern is at $300.

$BTCUSD (Bitcoin / USD) – Second Bearish Flag Formation For Bitcoin
Bitcoin ($BTCUSD -0.26%) second successive bearish flag formation remains in play.
The level of support to watch for $BTCUSD this week is at $17,500, the lowest level year to date.

$PCCE (Put/Call Ratio Equity) & $VIX (Volatility S&P 500) – Persistence in Reflection of Imminent Major Sell Off Ahead
VIX >30 is assumed to accompany large volatility, resulting from increased uncertainty, risk, and investor fear. VIX <20 generally correspond to stable, stress-free periods in the market. Higher VIX levels equates to more expensive options premium and vice versa for lower VIX level.
The spike level to watch for $PCCE in the last 24 months period is at 1.00. The current reading of 0.842 (+9.74%) remains elevated and poses likelihood and risk of accelerated selling for this week.
The CBOE Volatility index ($VIX), also known as Wall Street’s fear gauge, declined to 24.22 (-1.74%).
The weekly build up in momentum of both $PCCE and $VIX is reflecting a major sell off ahead remains imminent for the equities market.

$IEI/$HYG (Credit Spread) – $TNX (10YR Treasury Yield) – Highest Credit Spread Level Since November 2020
Market participants are keeping a close watch on credit spreads as one of the better economic signals. Junk bond issuers are perceived to be bigger credit risks, so if economic growth slows or contracts, there will be increased angst that these issuers won’t be able to make good on their interest payments. Hence, a widening high-yield spread is regarded as a leading indicator of difficult economic times which, in turn, often invites a more challenging period for the stock market since difficult economic times translate into weaker earnings prospects.
Credit Spread further edge down to 1.58% (-0.01) after setting a high of 1.62% at the start of the month as the volatility in the equity market resumes. This was the highest spread level since November 2020.
Treasuries gave back the bulk of their gains from the start of the month with the benchmark 10 year yield decreased by 17 bps to 2.93% for the week.

NAAIM Exposure Index 26.74 (-3.99%)
The NAAIM Exposure Index represents the average exposure to US Equity markets reported by members of the National Association of Active Investment Managers. It provides insight into the actual adjustments active risk managers have made to client accounts over the past two weeks. The blue line depicts a two-week moving average of the NAAIM managers’ responses.
This week’s NAAIM Exposure Index number is: 26.74
Top Trading Ideas for the Week
$PRVA – Healthcare | Health Information Services
healthcare sector is the top performing sector on basis of 1 month relative strength. $PRVA currently trading above all KMAs, along with key VWAPs (IPO & ATH). have also cleared a key pivotal level at $33 this week. pic.twitter.com/tInJb9fdUB
— Jeff Sun, CFTe (@jeffsuntrading) July 8, 2022
$GTLB – Technology | Software – Application
another tech name; resilient in RS, trading to its rising 10/20 MAs, based at $32 major support since March. have reported stable, increasing qtr sales number since IPO.
currently trading just beneath its IPO VWAP, similar to $DUOL pic.twitter.com/4MKrTK8QMJ
— Jeff Sun, CFTe (@jeffsuntrading) July 8, 2022
$BMBL – Technology | Software – Application
probably the weakest of the lot I shared today as this only came to my attention today.
but anything with YTD RS high, above all KMA with 3 months base pattern will definitely be in my WL. pic.twitter.com/tI9Ejt5XgI
— Jeff Sun, CFTe (@jeffsuntrading) July 8, 2022

