

The first week of August ended up being another winning week for the stock market. There were some assumptions that the market would face selling pressure from mean revision after the huge move it made in July. The S&P 500 and Nasdaq ended with +0.4% and +2.2% respectively.
Wednesday’s July U.S. inflation data will be the main highlight this week after last Friday’s much stronger-than-anticipated jobs report quashed hopes that the Federal Reserve may relent in its aggressive campaign to tame the highest inflation in decades. Any indication that inflation is still not close to peaking could test the recent rally in U.S. stock markets.
Here’s what you need to know to start your week.
1. Test for U.S. stock market rally
A rally in U.S. stocks may be tested this week as Wednesday’s inflation data could quash hopes for a dovish shift by the Fed after it delivered 225 bps worth of rate hikes so far this year.
The S&P 500 and the Nasdaq ended July with their biggest monthly percentage gains since 2020, boosted in part by hopes that the Fed may pull back in its aggressive campaign to curb inflation.
Continued gains could hinge on whether investors believe the Fed is succeeding in its battle against inflation. Signs that inflation is still not peaking could dent expectations that the central bank will be able to stop hiking rates early next year, sending stocks lower.
2. Earnings
Markets are more than halfway into the second-quarter reporting period and so far, U.S. companies have been reporting mostly upbeat news, surprising investors who had been bracing for a gloomier outlook on both businesses and the economy.
Some 78% of earnings reports are beating Wall Street expectations, above the long-term average, according to Reuters.
Going into earnings season, investors had been worried that if high inflation and rising interest rates were about to tip the economy into recession, earnings estimates for 2022 were too high.
Disney ($DIS), the highest profile name to report in the coming week will release results after the market close on Wednesday. Some other names set to report during the week include Take-Two ($TTWO), Palantir ($PLTR), Wynn Resorts ($WYNN), Six Flags ($SIX) and travel stocks Norwegian Cruise Line ($NCLH) and Spirit Airlines ($SAVE).
Key Economic Calendar (Weekly)
Inflation has for months confounded expectations that it would ease, remaining more than three times higher than the Fed’s 2% target.
Investors’ attention will be focused on Wednesday’s consumer price index figures with economists expecting the annual rate of inflation to moderate to 8.7% in July from 9.1% in June, which was the largest increase since 1981.
But core CPI is expected to increase by 0.5% month-over-month, pushing the annual rate up to 6.1% from 5.9% in June, underlining the difficulty the Fed faces trying to get inflation back in line with its target.
Producer price index figures for July will be released on Thursday, along with the weekly report on initial jobless claims, while the University of Michigan consumer sentiment index will be published on Friday.
All times listed are EDT
Wednesday
8:30: US – Core CPI m/m: forecast to decline to 0.5% from 0.7%
Thursday
8:30: US – PPI m/m: forecast to decline to 0.3% from 1.1%
Friday
8:30: US – Prelim UoM Consumer Sentiment: predicted to increase from to 51.5 to 52.5
Top 3 Leading and Lagging Sectors (Weekly)
WTI crude prices slumped below $90.00 per barrel last week, settling Friday at $88.73 per barrel. That move undercut the energy sector, which was the worst-performing sector last week with a -5.2% decline (including a +2.0% gain on Friday). The best-performing sectors were the technology (+3.3%), communication services (+1.5%), and consumer cyclical (+1.3%) sectors.

Market Breath (Weekly)
% of Stocks Above 50 DMA = 69.21% (+1.64%)
% of Stocks Above 200 DMA = 32.83% (+5.73%)

Market Technicals – (S&P 500, NASDAQ, Bitcoin, Bonds & Credit Spread, NAAIM)

$SPX (S&P 500) vs $RSP (S&P 500 Equal Weight) – (Net High/Low +59)
$SPX scored its third straight winning week with further gains of +0.36% last week, closing at 4,145 level. In turn, $SPX remains above its 50-day moving average for the first time since April 2022.
The relative resilience of the stock market after last week’s employment report squashed its seemingly preferred outcome (i.e. weak data that suggested the Fed will be lowering rates in the first half of 2023) likely revolved around two, alternative takes on the data:
- The continued strength of the labor market shows that the economy can handle the Fed’s rate hikes without devolving into a hard-landing scenario, or
- Employment is a lagging indicator, and given the lag effect of the Fed’s rate increases, there will be much weaker numbers in coming months that will invite a friendlier shift in monetary policy sooner rather than later
The support to watch for this week remains 3,950 level, a resistance turned support level that would also slice through the existing rising 10/20/50-day moving averages.

$QQQ (Nasdaq 100) vs $QQQE (Nasdaq 100 Equal Weight) – Remains the Weakest Major Index Year To Date, But Relative Strength In Play
Tech and growth names have been hard hit since the start of 2022 by a rapid rise in Treasury yields on the back of expectations that the Fed will hike interest rates aggressively to combat high inflation as higher rates can hurt their companies with high valuations based on the prospect of future profits.
$QQQ remains as the weakest major index year to date with -19.1% return, but this laggard gap has been tightening since the beginning of July 2022. $QQQ posted a weekly gain of +1.99% for the week, affirming its relative strength against $SPX since 25th May, At the current juncture, $QQQ have traded out of its month long Bullish Ascending Triangle pattern that was highlighted three weeks ago.
The support level to watch for $QQQ this week remains at $295, an immediate resistance turned support level that would also slice through the existing rising 10/20/50-day moving averages.

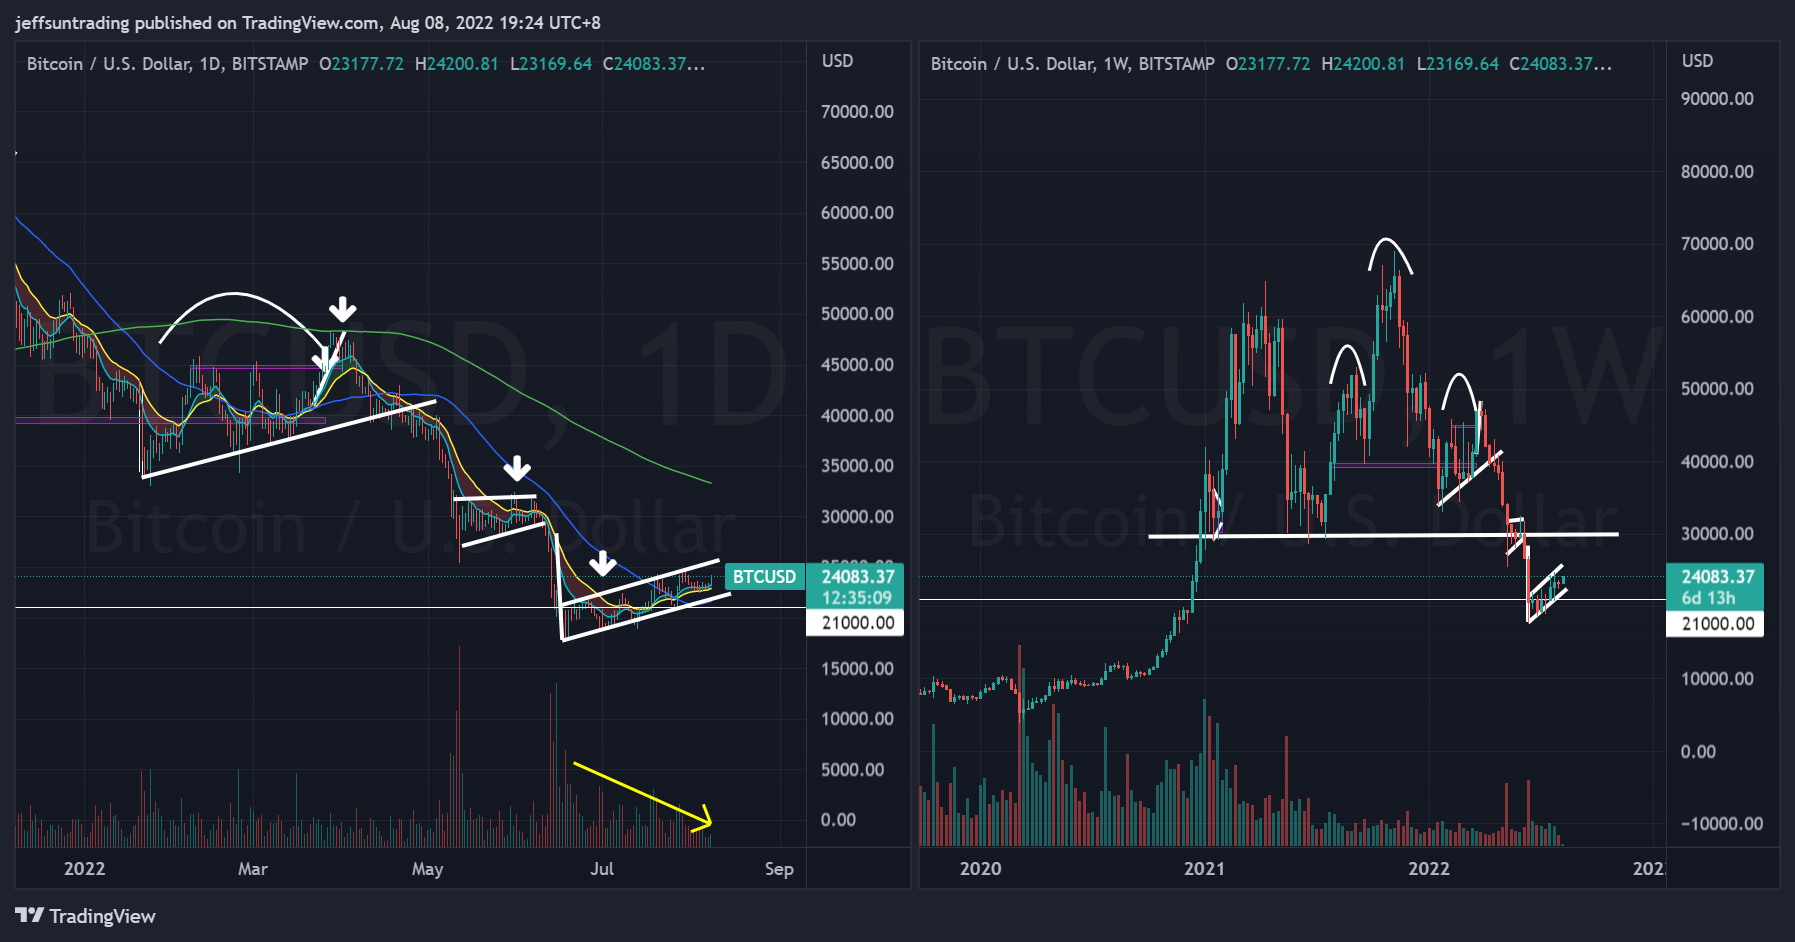
$BTCUSD (Bitcoin / USD) – Second Bearish Flag Formation For Bitcoin
Bitcoin ($BTCUSD -0.58%) second successive bearish flag formation remains in play.
The level of support to watch for $BTCUSD this week is at $21,000, a level that would slice through the existing flatten 10/20/50-day moving averages, before a year-till-date support low breakdown.

$PCCE (Put/Call Ratio Equity) & $VIX (Volatility S&P 500) – Persistence in Reflection of Imminent Major Sell Off Ahead
VIX >30 is assumed to accompany large volatility, resulting from increased uncertainty, risk, and investor fear. VIX <20 generally correspond to stable, stress-free periods in the market. Higher VIX levels equates to more expensive options premium and vice versa for lower VIX level.
The spike level to watch for $PCCE in the last 24 months period is at 1.00. The current reading of 0.781 (-9.09%) remains elevated and poses likelihood and risk of accelerated selling for the month of August.
Similarly, the CBOE Volatility index ($VIX), also known as Wall Street’s fear gauge, declined to 21.14 (-0.84%).
The weekly build up in momentum of both $PCCE and $VIX is reflecting a major sell off ahead remains imminent for the equities market.

$IEI/$HYG (Credit Spread) – $TNX (10YR Treasury Yield) – Highest Credit Spread Level Since November 2020 registered in June 2022
Market participants are keeping a close watch on credit spreads as one of the better economic signals. Junk bond issuers are perceived to be bigger credit risks, so if economic growth slows or contracts, there will be increased angst that these issuers won’t be able to make good on their interest payments. Hence, a widening high-yield spread is regarded as a leading indicator of difficult economic times which, in turn, often invites a more challenging period for the stock market since difficult economic times translate into weaker earnings prospects.
Credit Spread further edge down to 1.53% (-0.02) after setting a high of 1.62% at the end of June as the volatility in the equity market resumes. This was the highest spread level since November 2020.
The 2-yr note yield, which hit 2.80% earlier last week and stood at 3.05% right in front of last week’s non-farm payroll report, settled Friday’s session at 3.23% (up 33 basis points). The 10-yr note yield, which hit 2.53% earlier in the week and stood at 2.70% right in front of the report, settled Friday’s session at 2.84% (up 20 basis points).

NAAIM Exposure Index 55.28 (+17.09%)
The NAAIM Exposure Index represents the average exposure to US Equity markets reported by members of the National Association of Active Investment Managers. It provides insight into the actual adjustments active risk managers have made to client accounts over the past two weeks. The blue line depicts a two-week moving average of the NAAIM managers’ responses.
This week’s NAAIM Exposure Index number is: 55.28
Top Trading Ideas for the Week
$SGFY – Healthcare | Health Information Services
15 mths into IPO, $SGFY traded as low as -66% to a ATL of $11 range. the level is acting as a major support with price action bouncing off the range on 4 occasion in 2022
wkly price action reflects a DTL BO since July. ER on 3/8 pic.twitter.com/9LmIAehDj9
— Jeff Sun, CFTe (@jeffsuntrading) July 28, 2022
$VET – Energy | Oil & Gas E&P$VET has a clean $24 round number pivot that could be challenged at the market open. currently sitting above all KMAs. This name as been resilient to its rising 30W MA on the weekly, also reflecting RS.
triple digit QoQ sales growth over past 4Qs pic.twitter.com/LvARmBTo8r
— Jeff Sun, CFTe (@jeffsuntrading) July 26, 2022
$BMBL – Technology | Software – Application
probably the weakest of the lot I shared today as this only came to my attention today.
but anything with YTD RS high, above all KMA with 3 months base pattern will definitely be in my WL. pic.twitter.com/tI9Ejt5XgI
— Jeff Sun, CFTe (@jeffsuntrading) July 8, 2022