

US equity and bond markets are closed on Monday for the Fourth of July holiday (Independence Day).
Wall Street’s three major stock indexes ended sharply higher on Friday, rebounding from early losses on the first trading day of the third quarter, in the wake of the stock market’s worst first half in decades. Still, all three indexes posted steep losses for the week. The S&P 500 declined -2.2% this week and the Nasdaq Composite sunk -4.1%.
U.S. equity markets are embarking on an uncertain third quarter after the worst first half since 1970 with the Fed rapidly tightening monetary policy to quell the highest inflation in decades. Friday’s jobs report along with Wednesday’s minutes of the Federal Reserve’s June meeting are set to be the highlights of the holiday-shortened week ahead as worries over the prospect of a recession swirl.
Here’s what you need to know to start your week.
1. U.S. jobs report
Recent economic data has added to signs that the economy is cooling amid aggressive policy tightening by the Fed, so investors will be closely watching Friday’s nonfarm payrolls report for how the labor market is performing, given the Fed’s inflation/employment mandate.
Economists are expecting 270,000 jobs to have been added in June, slowing from 390,000 in the previous month but still remaining strong. The unemployment rate is expected to remain steady at 3.6%, pointing to still solid demand even as the economy cools. Average hourly earnings are expected to have increased by 5% on a year-over-year basis.
A weaker-than-expected jobs report could exacerbate fears of a recession and bolster the argument for a less aggressive pace of rate hikes, following the Fed’s most recent 75 basis point move.
2. Fed minutes
The Fed is expected to push ahead with another 75 basis point rate hike at its upcoming July meeting, but the path for September is less clear.
Wednesday’s minutes from the central bank’s June meeting will give investors some insight into how policymakers see the future path of interest rates as markets remain focused on the prospect of a recession.
3. Stocks kick off Q3
Market participants are now bracing for several potentially pivotal events in July that could dictate the direction markets take over the coming months.
Investors will be turning their attention to Friday’s employment report ahead of the following week’s U.S. inflation data which will factor into the Fed’s decision making at its upcoming meeting on July 26-27.
Second-quarter earnings start arriving in force the week of July 11, indicating whether companies can keep living up to estimates despite surging inflation and growth worries.
Key Economic Calendar (Weekly)
The U.S. is to publish data on JOLTs job openings for May on Wednesday with the number of vacancies expected to slow only slightly to 11 million from 11.4 million in April, equivalent to almost two vacancies for every unemployed American.
The lack of suitable workers available to fill these positions has seen wages increase as companies compete for labor, feeding into the spiral of faster inflation.
The U.S. is also to publish the ISM services PMI for June after last’s week’s ISM manufacturing PMI pointed to a slowdown in both new orders input prices, along with data on factory orders, initial jobless claims and consumer credit.
All times listed are EDT
Monday
US stock and bond markets are closed for the Fourth of July holiday.
Wednesday
10:00 US – JOLTS Job Openings: predicted to have edged down to 10.85m to 11.40m
2:00 US – FOMC Meeting Minutes
Friday
8:30: US –Non-Farm Employment Change: predicted to edge down to 275k from 390k
Top 3 Leading and Lagging Sectors (Weekly)
The utilities sector jumped +3.4%. Meanwhile, the energy sector jumped +1.5%. The biggest loser are technology (-5.2%) and communication services (-4.9%) respectively.

Market Breath (Weekly)
% of Stocks Above 50 DMA = 31.36% (-1.94%)
% of Stocks Above 200 DMA = 19.41% (+1.62%)

Market Technicals – (S&P 500, NASDAQ, Bitcoin, Bonds & Credit Spread, NAAIM)

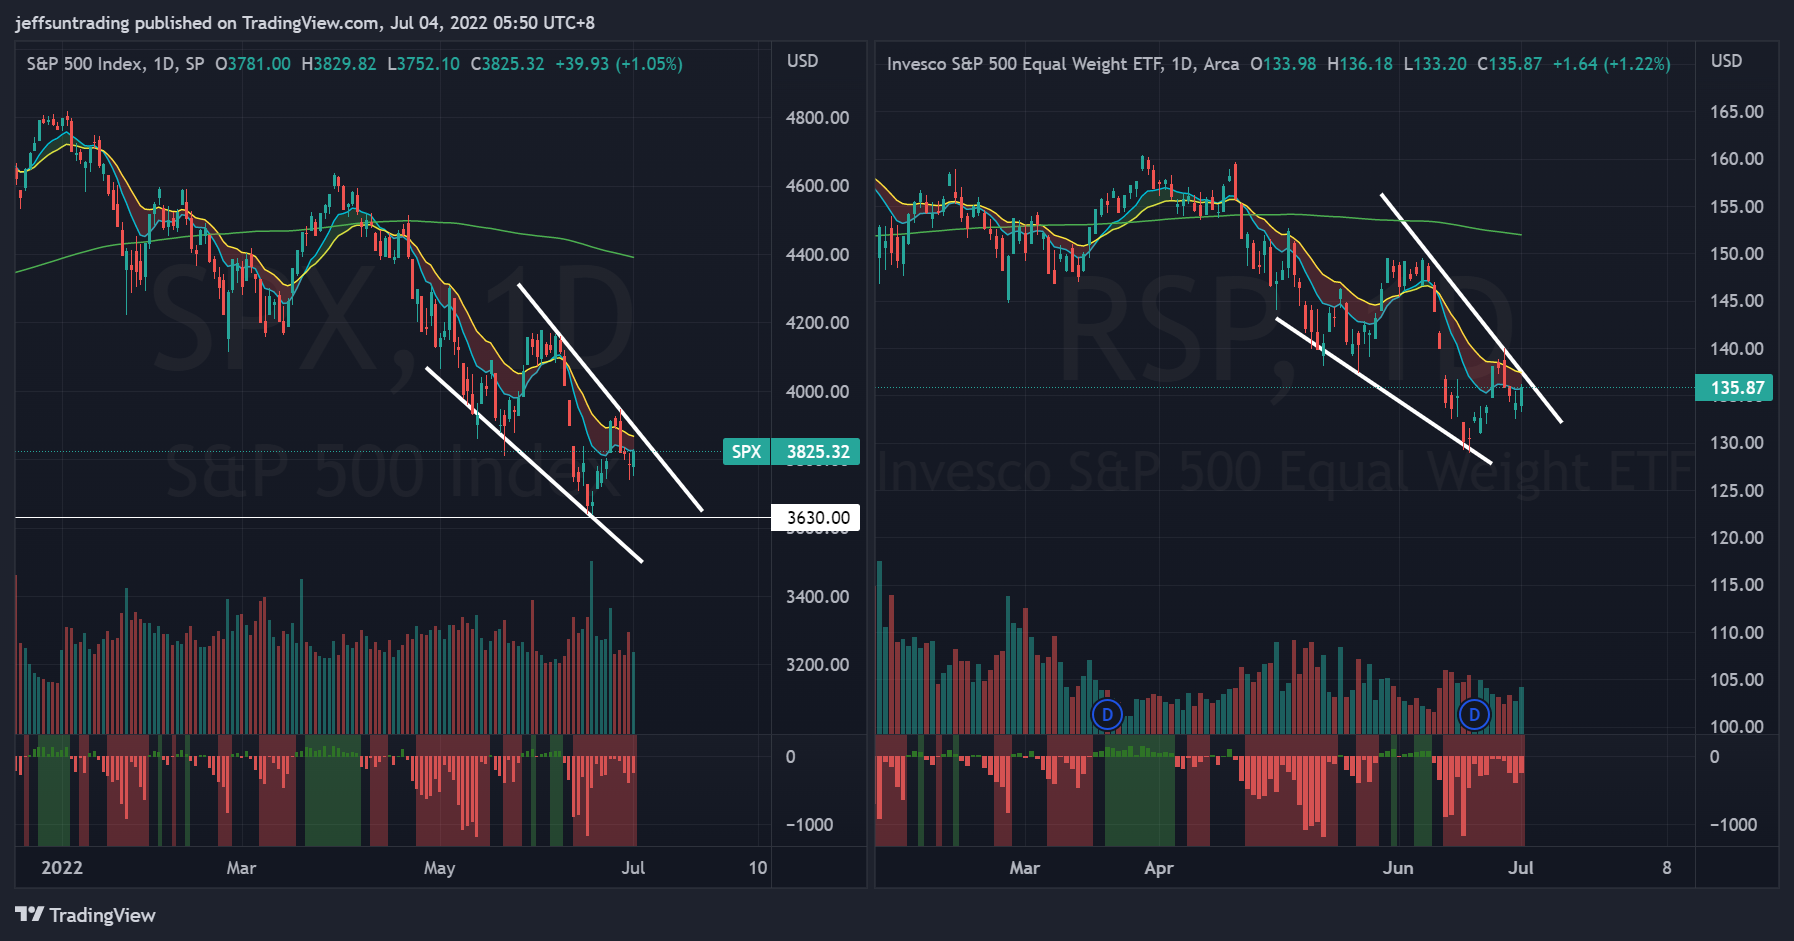
$SPX (S&P 500) vs $RSP (S&P 500 Equal Weight) – (Net High/Low -239)
$SPX spiral back to losses (-2.21%) for the week, setting its worst 1st half since 1970.
The main story lines were all too familiar. There were concerns about economic growth, earnings growth, inflation, and central bank rate hikes. There was notable weakness in the mega-cap stocks and semiconductor shares. There was notable relative strength in the energy sector and the counter-cyclical sectors.
At the current junction, the index remains in a clear descending wedge pattern with lower highs & and lower lows.
The immediate support to watch for this week remains at 3,630 level, the lowest level traded year to date.

$QQQ (Nasdaq 100) vs $QQQE (Nasdaq 100 Equal Weight) – Remains the Weakest Major Index Year To Date
Tech and growth names have been hard hit since the start of 2022 by a rapid rise in Treasury yields on the back of expectations that the Fed will hike interest rates aggressively to combat high inflation as higher rates can hurt their companies with high valuations based on the prospect of future profits.
$QQQ posted a steeper loss of -4.24% for the week, remaining as the weakest major index year to date.
The support level to watch for $QQQ this week remains at $269, the lowest level traded year to date.

$BTCUSD (Bitcoin / USD) – Bearish Head and Shoulder Pattern Remains In Play on Bigger Picture, after Bearish Flag Breakdown
Bitcoin ($BTCUSD) broke down of its bearish flag that was highlighted last week, posting a loss of -8.42% for the week.
The level of support to watch for $BTCUSD this week remains at $11,600, a major resistance-turned-support level.

$PCCE (Put/Call Ratio Equity) & $VIX (Volatility S&P 500) – Reflection of Imminent Major Sell Off Ahead
VIX >30 is assumed to accompany large volatility, resulting from increased uncertainty, risk, and investor fear. VIX <20 generally correspond to stable, stress-free periods in the market. Higher VIX levels equates to more expensive options premium and vice versa for lower VIX level.
The spike level to watch for $PCCE in the last 24 months period is at 1.00. The current reading of 0.810 (+25.11%) have posed likelihood and risk of accelerated selling for this week.
The CBOE Volatility index ($VIX), also known as Wall Street’s fear gauge, conversely declined to 26.71 (-2.02%), but remains at elevated level for caution.
The weekly build up in momentum of both $PCCE and $VIX is reflecting a major sell off ahead remains imminent for the equities market.

$IEI/$HYG (Credit Spread) – $TNX (10YR Treasury Yield) – Highest Credit Spread Level in 15 Months
Market participants are keeping a close watch on credit spreads as one of the better economic signals. Junk bond issuers are perceived to be bigger credit risks, so if economic growth slows or contracts, there will be increased angst that these issuers won’t be able to make good on their interest payments. Hence, a widening high-yield spread is regarded as a leading indicator of difficult economic times which, in turn, often invites a more challenging period for the stock market since difficult economic times translate into weaker earnings prospects.
Credit Spread further edge up towards 1.62% (+0.04) as the volatility in the equity market resumes. This is the highest spread level in 15 months.
The yield on the 2-yr note sank 23 basis points to 2.83% while the yield on the 10-yr note dropped 24 basis points to 2.89%. Those moves were catalyzed by some disappointing economic data that included a weaker-than-expected Consumer Confidence Index for June that featured the lowest reading for the Expectations Index (66.4) since March 2013 and a bump in the year-ahead inflation expectation to 8.0% from 7.5%.

NAAIM Exposure Index 30.66 (+54.38%)
The NAAIM Exposure Index represents the average exposure to US Equity markets reported by members of the National Association of Active Investment Managers. It provides insight into the actual adjustments active risk managers have made to client accounts over the past two weeks. The blue line depicts a two-week moving average of the NAAIM managers’ responses.
This week’s NAAIM Exposure Index number is: 30.66
Top Trading Ideas for the Week
$DQ – Semiconductor Equipment (China)
with many of the china names setting a new 52wks high, $DQ have rallied beyond its 15 months wedge pattern, trading above all KMAs to its rising 10/20 MAs.
what sets $DQ apart from other names is its exponentiated growth in latest pic.twitter.com/XuHbmsSZJc
— Jeff Sun, CFTe (@jeffsuntrading) June 20, 2022

