
This week, investors will get an update on the strength of the US labor market as there will be more clarity on the impact of the rapid spread of the omicron that led to more shutdowns and an increase in hospitalizations. This would also gauge how aggressively the Federal Reserve may act on its fight against inflation.
Elevated market volatility looks set to continue with tech giants Amazon ($AMZN) and Google parent Alphabet ($GOOGL) set to report their earnings.
Bitcoin’s weakness is currently reflecting another leg of bearish flag pattern, leading to speculation that a further stock market wash-out may be on the line.
Here’s what you need to know to start your week
1. U.S. jobs report
The U.S. is to release the January nonfarm payrolls report on Friday with economists forecasting that the economy added 155,000 jobs, slowing from 199,000 in December as the Omicron variant hit.
Indications of continued strength in the labor market could add to bets on how aggressive the Fed may be in tightening monetary policy in its battle to combat high inflation.
The Fed flagged a March rate hike after its policy meeting last week and Chair Jerome Powell acknowledged that officials may move even faster than the four rate hikes markets have already priced in for this year.
On Friday, Atlanta Fed President Raphael Bostic said the central bank could hike rates by as much as half a percentage point if warranted by economic data.
Goldman Sachs ($GS) is forecasting that the Fed will hike rates five times this year, up from four previously, with a first hike expected in March, according to a note from its economists late on Friday.
2. Earnings
The strength of fourth-quarter earnings results, which continue to roll in with S&P 500 earnings season not yet at the halfway point, could bolster the case for investors looking to buy at a discount.
Another large batch of earnings reports is due during the week, including from heavyweights Alphabet ($GOOGL) and Amazon ($AMZN), on Tuesday and Thursday, respectively.
Tech stocks have come under pressure so far this year as investors have been more reluctant to pay hefty valuations for growth stocks amid rising yields as the Fed plans to tighten policy to tame inflation. So far this earnings season investors have been focused on guidance, and the extent to which companies expect ongoing global supply challenges to affect their bottom line going forward. Uneasy investors have punished companies such as Netflix ($NFLX) and JPMorgan ($JPM) who delivered underwhelming results in recent weeks.
Other earnings of note this week include Meta Platforms ($FB) ,General Motors ($GM) ,Ford ($F), Exxon Mobil ($XOM), Bristol-Myers Squibb ($BMY) and Merck ($MRK)
Key Economic Calendar (Weekly)
All times listed are EST
Monday
Markets closed for Spring Festival in China, New Year’s Day in South Korea, and Chinese New Year in Hong Kong
Tuesday
Markets remain closed in China, South Korea, and Hong Kong for holidays
10:00: US – ISM Manufacturing PMI: to edge lower to 57.5 from 58.7.
10:00: US – JOLTs Job Openings: anticipated to rise to 11.075M from 10.562M.
Wednesday
Markets remain closed in China, South Korea, and Hong Kong for holidays
8:15: US – ADP Nonfarm Employment Change: seen to have dropped by almost 75% to 208K from 807K.
10:30: US – Crude Oil Inventories: previous print showed a build of 2.377M barrels.
Thursday
China and Hong Kong remain on holiday
10:00: US – ISM Non-Manufacturing PMI: expected to decline to 59.3 from 62.3.
Friday
China’s markets remain closed for Spring Holiday
8:30: US – Nonfarm Payrolls: predicted to drop by almost a quarter to 155K from 199K.
8:30: US – Unemployment Rate: anticipated to remain at 3.9%.
Top 3 Leading and Lagging Sectors (Weekly)
1. $XLE (Energy) +5.09%
2. $XLK (Technology)+2.38%
3. $XLF (Financial) +1.36%
Benchmark: $SPY +0.91%
1. $XLI (Industrial) -1.48%
2. $XLY (Consumer Discretionary) -1.29%
3. $XLU (Utilities) -1.28%
Market Breath (Weekly)
% of Stocks Above 200 DMA = 29.80% (-4.79%)
% of Stocks Above 50 DMA = 22.88% (+3.06%)
Market Technicals (Distribution Cycle Count: Day 11)

$SPX (S&P 500) vs $RSP (S&P 500 Equal Weight) – (Net High/Low -688)
The steep slide in U.S. stocks in January has prompted some investors to begin looking at equity valuations to see whether now is a good time to snap up shares at bargain prices. The S&P 500 has dropped over 9% so far in 2022, while the tech-heavy Nasdaq stands in correction territory after a nearly 15% fall.
$SPX ended the market week on positive with a weekly gain of +0.77%. Even so, $SPX remains trading below all major moving averages, the first time since March 2020. The US market Net High/Lows also affirmed the bearish theme with further deterioration of -635 companies within its constituents.
The immediate support to watch for $SPX this week remains at a retest of 4,330 level, the previous major low established in $SPX during October 2021.

$QQQ (Nasdaq 100) vs $QQQE (Nasdaq 100 Equal Weight)
Tech and growth names have been hard hit since the start of 2022 by a rapid rise in Treasury yields on the back of expectations that the Fed will hike interest rates aggressively to combat high inflation as higher rates can hurt their companies with high valuations based on the prospect of future profits.
With $QQQ grinding out with a minimal gain of +0.03%, $QQQE continues its technical correction from the highlighted bearish inverse head and shoulder pattern with a further loss of -1.47% over the week. Similar to $SPX, both $QQQ and $QQQE are below their major moving averages.
The support level to watch for $QQQ is at the re-test of $349.50 level.

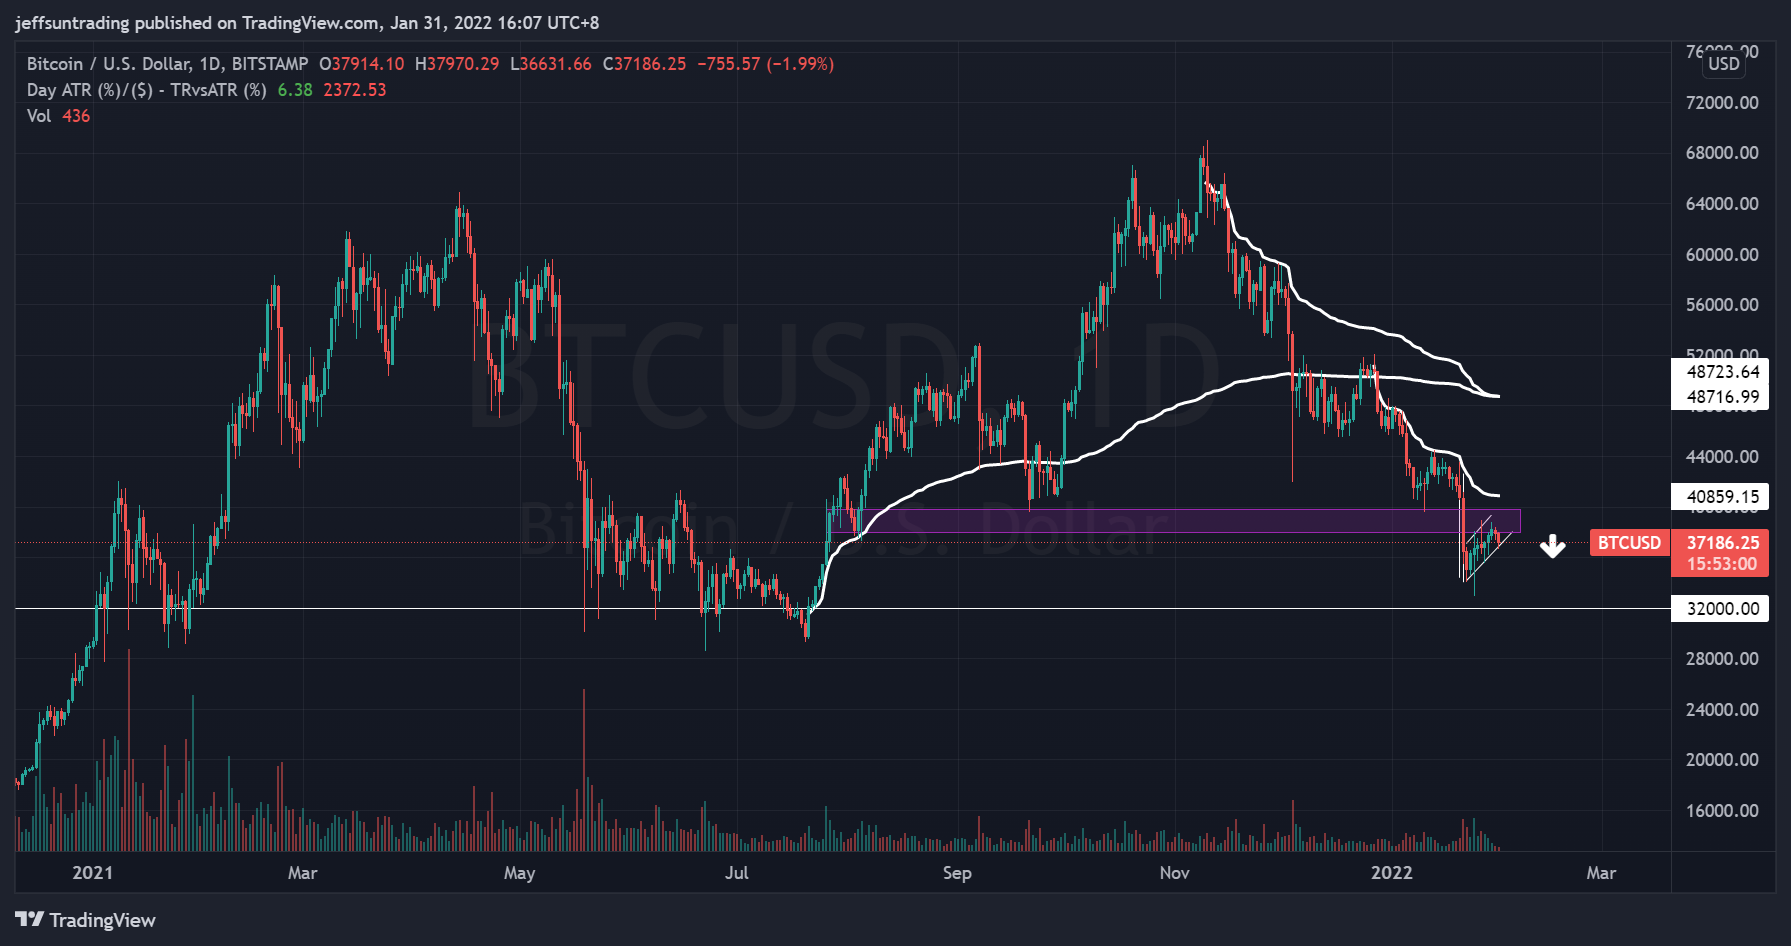
$BTCUSD (Bitcoin / USD)
Bitcoin ($BTCUSD) has been consolidating below a major resistance over the past two weeks now, with its price action morphing out another bearish flag pattern. Similar bear flag pattern on $BTCUSD was witnessed in November’21 and early January this year.
The major support level for $BTCUSD is at $32,000 level. Then breakdown of this level would play out a major one year bearish double top pattern.

$PCCE (Put/Call Ratio Equity) & $VIX (Volatility S&P 500)
The spike level to watch for $PCCE is at 1.00, where the current reading of 0.953 (-16.81%) reflects potential bottom of the sell off we witnessed in the major market indexes during the month of January. However, $VIX reading of 28.23 (+2.31%) remains elevated.

$IEI/HYG (Credit Spread) – $TNX (10YR Treasury Yield)
Credit Spread edged up to 1.50% (+0.01) over the week. Similarly, $TNX edged up to 1.783% (+0.037).
With subtle development in $TNX over the past two weeks, a further wash-out in the market will bring $TNX to 1.95% in the near term with its past weeks momentum.
NAAIM Exposure Index
The NAAIM Exposure Index represents the average exposure to US Equity markets reported by members of the National Association of Active Investment Managers. It provides insight into the actual adjustments active risk managers have made to client accounts over the past two weeks.
This week’s NAAIM Exposure Index number is: 53.39

Top Trading Ideas for the Week
$PTEN is a onshore drilling contractor for o&g operators in US and CA.
RS as it traded to one month high, higher lows since dec’21 with rising in all MAs of various timeframe. cup and 2 years cup and handle pattern.
we have a good 2 weeks to Q4 earnings for some risk cushion. pic.twitter.com/DsXkWto84Y
— Jeff Sun (@jeffsuntrading) January 27, 2022
$RHI RS continues trend higher as its range of price action gets further consolidated within the ascending triangle.
Q4’21 ER YoY announced on 27/2
EPS 1.51 (+80%)
Sales 1.77B (+36%) pic.twitter.com/VWzlomPDmM— Jeff Sun (@jeffsuntrading) January 30, 2022

