
The earnings season enters one of its busiest phases this week with tech giants Microsoft ($MSFT), Apple ($AAPL) and Tesla ($TSLA) are due to report. Investors will be seeking reassurance from earnings result after last week’s selloff, but market volatility looks set to continue for now.
Fed Chair Jerome Powell is expected to signal that the central bank is on course to deliver its first rate hike since 2018 in March, in a bid to tackle soaring inflation. There is also data on U.S. Q4 GDP.
Here’s what you need to know to start your week.
1. Earnings
Tech giants Microsoft ($MSFT), Apple ($AAPL) and Tesla ($TSLA) are among the big-name companies due to report in what will be a hectic week of earnings results, with investors looking to separate pandemic success stories from fundamentally strong companies.
FAANG darling Netflix ($NFLX) tumbled over 20% on Friday, weighing on the S&P 500 and the Nasdaq, after it forecast new subscriber growth in the first quarter would be less than half of analysts’ predictions.
Microsoft, which reports Tuesday, is expected to report quarterly revenue of more than $50 billion for the first time, according to data compiled by FactSet.
Tesla and Apple, reporting Wednesday and Thursday respectively, are expected to post record profits according to FactSet.
Beyond tech, there are a host of other big companies reporting including 3M ($MMM), GE ($GE), IBM ($IBM), Intel ($INTC), Caterpillar ($CAT) and American Express ($AXP). Boeing ($BA), Mastercard ($MA), Visa ($V), McDonald’s ($MCD), Johnson & Johnson ($JNJ), and Colgate-Palmolive ($CL) are also scheduled to report.
2. Fed to signal March rate hike
Investors are looking to the Fed for more clarity on the future path of interest rates after data last week showed U.S. inflation rising to near forty-year highs.
Jerome Powell is expected to indicate that the Fed will wind up its bond purchasing stimulus program on schedule at its March meeting and raise interest rates by a quarter point from current levels close to zero at the same meeting.
With markets already pricing in roughly four rate hikes this year investors will also be focusing on what the Fed says about its almost $9 trillion balance sheet.
Markets currently expect the Fed to start trimming the balance sheet later in the year as a way to tighten monetary policy. The minutes of the Fed’s December meeting indicated that officials held lengthy discussions about reducing bond holdings.
Any indications that the balance sheet could be shrunk faster than in the past could extend the selloff in Treasuries and tech shares.
Key Economic Calendar (Weekly)
On Thursday the U.S. is to release advance data on fourth quarter gross domestic product with economists expecting annualized growth of 5.3%. Expectations have been pared back in recent weeks as rising coronavirus cases, driven by the Omicron variant hit economic activity.
All times listed are EST
Monday
3:30: Germany – Manufacturing PMI: seen to retreat to 57.0 from 57.4.
Wednesday
14:00: US – Fed Interest Rate Decision
14:30: US – FOMC Press Conference
Thursday
8:30: US – GDP: anticipated to have more than doubled, to 5.3% from 2.3%.
Top 3 Leading and Lagging Sectors (Weekly)
1. $XLE (Energy) -0.92%
2. $XLP (Consumer Staples) -1.21%
3. $XLU (Utilities) -1.49%
Benchmark: $SPY -5.72%
1. $XLY (Consumer Discretionary) -8.62%
2. $XLF (Financial) -7.42%
3. $XLB (Materials) -6.16%
Market Breath (Weekly)
% of Stocks Above 200 DMA = 31.30% (-28.90%)
% of Stocks Above 50 DMA = 22.20% (-47.16%)
Market Technicals (Distribution Cycle Count: Day 6)

$SPX (S&P 500) vs $RSP (S&P 500 Equal Weight) – (Net High/Low -688)
Markets look set to remain turbulent in the coming week with investors focused on the Fed and earnings.
In a continuation of the tech selloff that has pushed the Nasdaq into correction territory, Wall Street’s main indexes closed sharply lower last week. The S&P 500 and the tech-heavy Nasdaq posted their largest weekly percentage declines since the start of the pandemic in March 2020. $SPX further declined -5.68%, after breaching the 4,610 support highlighted last week. $SPX is now trading below all major moving averages, the first time since March 2020. The $SPX Net High/Lows also affirmed the bearish theme with further deterioration of -688 companies within its constituents, similarly the lowest level since March 2020.
Till date, $SPX have corrected -8.73% from its high (4th January 2022). $RSP have corrected -6.81% from its high (5th January 2022).
With $RSP trading at its highest daily sessional volume on Friday (since 2004), we are likely to see a bounce off 200MA for the indexes this week, if $RSP could hold its Friday low of $152.82.
The immediate support to watch for $SPX this week is at 4,330 level, the previous major low established in $SPX during October 2021.

$QQQ (Nasdaq 100) vs $QQQE (Nasdaq 100 Equal Weight)
Tech and growth names have been hard hit since the start of 2022 by a rapid rise in Treasury yields on the back of expectations that the Fed will hike interest rates aggressively to combat high inflation as higher rates can hurt their companies with high valuations based on the prospect of future profits.
$QQQ have declined -7.45% along with -6.13% from $QQQE, successfully playing out the bearish head and shoulders chart pattern in $QQQE. Similar to $SPX, both $QQQ and $QQQE are below their major moving averages.
The high volume closed (>100% of average 50 days) on $QQQ have traditionally been a turning point for the index. $QQQ closed on friday with the highest volume in 11 months.
The support level to watch is $QQQ at $349.50 level.

$PCCE (Put/Call Ratio Equity) & $VIX (Volatility S&P 500)
The spike level to watch for $PCCE is at 1.00, where the current reading of 1.14 (+30.95%) affirm the status of the bear market territory we witnessed in the major market indexes.
$VIX reading similarly increase to 28.84 (+50.36%) also confirming the market correction we have experienced over the past week.
On the contrary, the current extreme reading of both $PCCE and $VIX would offer a low risk; high reward environment in stocks that have held their major support with relative strength against market indexes for the whole of this month. I have provided two names in the latter part of the article that are in my high priority list for this week.

$IEI/HYG (Credit Spread) – $TNX (10YR Treasury Yield)
Credit Spread edged up to 1.49% (+0.01) over the week. Interestingly, $TNX went lowered to 1.746% (-0.027). It remains for likely for $TNX to reach 1.95% by end of January with its past weeks momentum.
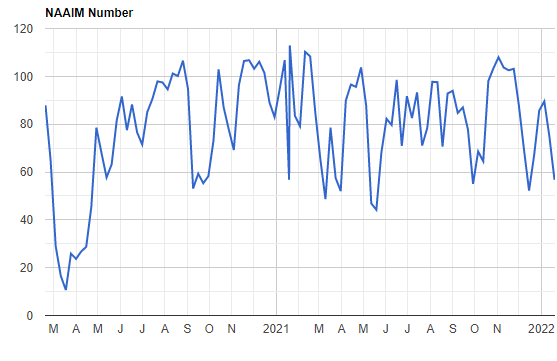
NAAIM Exposure Index
The NAAIM Exposure Index represents the average exposure to US Equity markets reported by members of the National Association of Active Investment Managers. It provides insight into the actual adjustments active risk managers have made to client accounts over the past two weeks.
This week’s NAAIM Exposure Index number is: 56.73

Top Trading Ideas for the week
$GXO exhibited RS for the whole of this week. HVC out of its wedge pattern but still below ATH VWAP.
would be wise to take a position only above 50MA since it is just barely $2.50 away. it gives more affirmation to the momentum that it may be building up pic.twitter.com/ZrcIhUcvCK
— Jeff Sun, CFTe (@jeffsuntrading) January 14, 2022
$RHI corrected -4.7% last week, closing beneath its 50MA again. on the flip side, it held onto its short term trendline support from dec 21.
10/20/50 MA all converging and flattening. an ascending triangle pattern in play currently. pic.twitter.com/Q7LEaAN4dS
— Jeff Sun, CFTe (@jeffsuntrading) January 24, 2022

